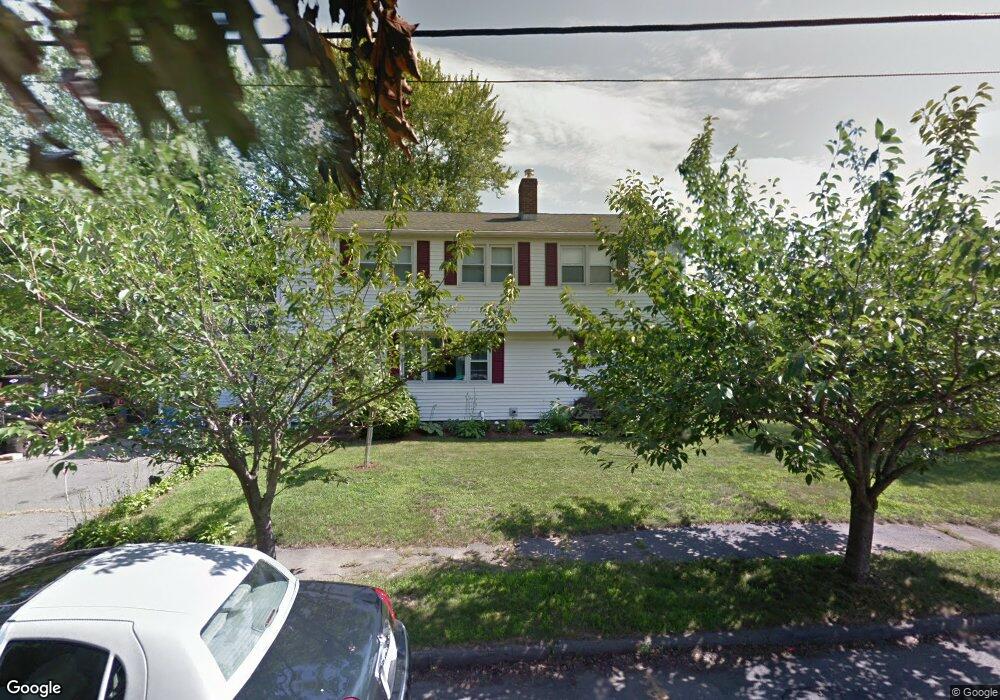
21 Ray St Danvers, MA 01923
Estimated Value: $725,000 - $825,000
4
Beds
2
Baths
2,144
Sq Ft
$360/Sq Ft
Est. Value
About This Home
This home is located at 21 Ray St, Danvers, MA 01923 and is currently estimated at $772,187, approximately $360 per square foot. 21 Ray St is a home located in Essex County with nearby schools including Danvers High School and St. Mary of the Annunciation School.
Ownership History
Date
Name
Owned For
Owner Type
Purchase Details
Closed on
Sep 2, 2025
Sold by
Maher Noreen L and Maher Thomas J
Bought by
Maher Ft and Maher
Current Estimated Value
Purchase Details
Closed on
Aug 16, 1993
Sold by
Eisnor Dennis P
Bought by
Maher Thomas J and Maher Noreenl
Purchase Details
Closed on
Dec 30, 1988
Sold by
Eisnor Janice M
Bought by
Eisnor Dennis P
Create a Home Valuation Report for This Property
The Home Valuation Report is an in-depth analysis detailing your home's value as well as a comparison with similar homes in the area
Home Values in the Area
Average Home Value in this Area
Purchase History
| Date | Buyer | Sale Price | Title Company |
|---|---|---|---|
| Maher Ft | -- | -- | |
| Maher Ft | -- | -- | |
| Maher Thomas J | $180,000 | -- | |
| Maher Thomas J | $180,000 | -- | |
| Eisnor Dennis P | $15,000 | -- |
Source: Public Records
Mortgage History
| Date | Status | Borrower | Loan Amount |
|---|---|---|---|
| Previous Owner | Eisnor Dennis P | $130,000 | |
| Previous Owner | Eisnor Dennis P | $100,000 | |
| Previous Owner | Eisnor Dennis P | $25,000 |
Source: Public Records
Tax History Compared to Growth
Tax History
| Year | Tax Paid | Tax Assessment Tax Assessment Total Assessment is a certain percentage of the fair market value that is determined by local assessors to be the total taxable value of land and additions on the property. | Land | Improvement |
|---|---|---|---|---|
| 2025 | $6,975 | $634,700 | $343,400 | $291,300 |
| 2024 | $6,998 | $629,900 | $343,400 | $286,500 |
| 2023 | $6,754 | $574,800 | $312,100 | $262,700 |
| 2022 | $6,668 | $526,700 | $283,300 | $243,400 |
| 2021 | $6,424 | $481,200 | $268,400 | $212,800 |
| 2020 | $6,244 | $478,100 | $265,300 | $212,800 |
| 2019 | $5,944 | $447,600 | $241,300 | $206,300 |
| 2018 | $5,809 | $429,000 | $238,900 | $190,100 |
| 2017 | $5,479 | $386,100 | $208,900 | $177,200 |
| 2016 | $5,278 | $371,700 | $199,300 | $172,400 |
| 2015 | $5,037 | $337,800 | $181,300 | $156,500 |
Source: Public Records
Map
Nearby Homes
- 57 Adams St
- 22 Collins St Unit 31
- 63 Adams St
- 152 Endicott St
- 2 Tomah Dr
- 108 Abington Rd Unit 108
- 14 Williams St Unit C17
- 9 Ledgewood Way Unit 6
- 10 Ledgewood Way Unit 18
- 6 Kimberly Dr
- 28 Sabino Farm Rd
- 35 High St Unit 3D
- 38 High St Unit 4
- 4 Price Rd
- 12 Central Ave Unit 1
- 267 Centre St
- 58 Trask Rd
- 261 Newbury St Unit 33B
- 14 Bourbon St Unit 25
- 39 Roosevelt Ave