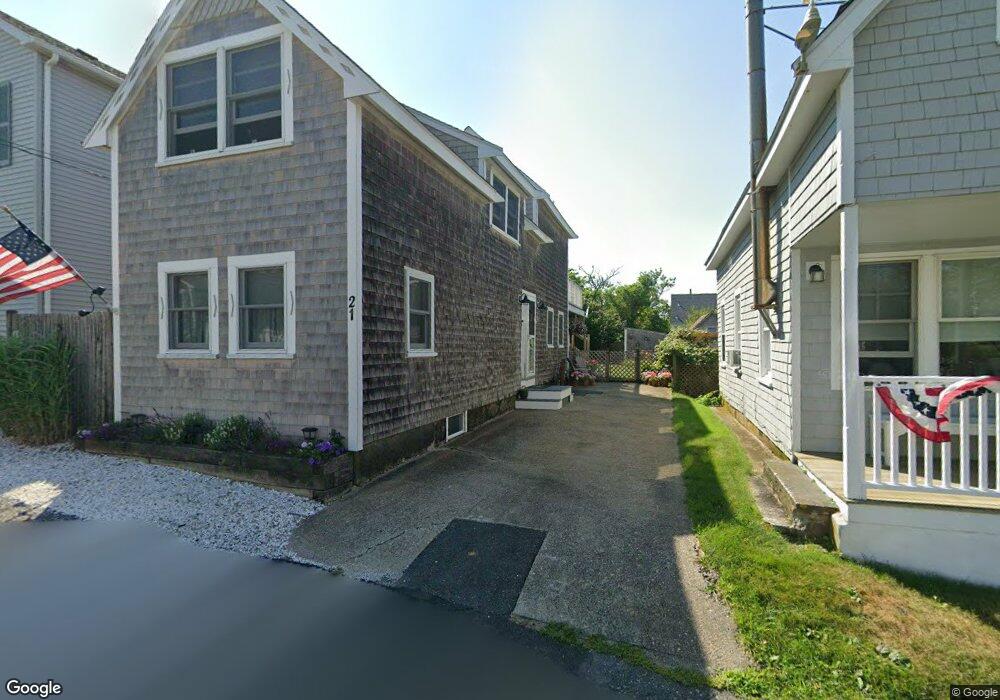
21 Reed St Brant Rock, MA 02020
Ocean Bluff-Brant Rock NeighborhoodEstimated Value: $502,220 - $662,000
2
Beds
1
Bath
852
Sq Ft
$664/Sq Ft
Est. Value
About This Home
This home is located at 21 Reed St, Brant Rock, MA 02020 and is currently estimated at $565,555, approximately $663 per square foot. 21 Reed St is a home located in Plymouth County with nearby schools including Governor Edward Winslow School, Furnace Brook Middle School, and Marshfield High School.
Ownership History
Date
Name
Owned For
Owner Type
Purchase Details
Closed on
Sep 1, 2009
Sold by
Everett Paula
Bought by
Rapoza Mary L
Current Estimated Value
Home Financials for this Owner
Home Financials are based on the most recent Mortgage that was taken out on this home.
Original Mortgage
$294,057
Outstanding Balance
$192,117
Interest Rate
5.17%
Mortgage Type
Purchase Money Mortgage
Estimated Equity
$373,438
Purchase Details
Closed on
Nov 14, 2003
Sold by
Rzucidlo Steven M
Bought by
Everett Paula
Purchase Details
Closed on
May 27, 1999
Sold by
Macleod Karen E and Macleod Dennis J
Bought by
Rzucidlo Steven M
Purchase Details
Closed on
Apr 27, 1994
Sold by
Macleod Dennis and Macleod Karen
Bought by
Quincy Sb
Purchase Details
Closed on
May 3, 1993
Sold by
Villa Franc C and Quincy Sb
Bought by
Abington Sb
Create a Home Valuation Report for This Property
The Home Valuation Report is an in-depth analysis detailing your home's value as well as a comparison with similar homes in the area
Home Values in the Area
Average Home Value in this Area
Purchase History
| Date | Buyer | Sale Price | Title Company |
|---|---|---|---|
| Rapoza Mary L | $309,000 | -- | |
| Rapoza Mary L | $309,000 | -- | |
| Everett Paula | $249,900 | -- | |
| Everett Paula | $249,900 | -- | |
| Rzucidlo Steven M | $153,600 | -- | |
| Rzucidlo Steven M | $153,600 | -- | |
| Quincy Sb | $12,500 | -- | |
| Abington Sb | $40,000 | -- |
Source: Public Records
Mortgage History
| Date | Status | Borrower | Loan Amount |
|---|---|---|---|
| Open | Abington Sb | $294,057 | |
| Closed | Abington Sb | $294,057 |
Source: Public Records
Tax History Compared to Growth
Tax History
| Year | Tax Paid | Tax Assessment Tax Assessment Total Assessment is a certain percentage of the fair market value that is determined by local assessors to be the total taxable value of land and additions on the property. | Land | Improvement |
|---|---|---|---|---|
| 2025 | $4,444 | $448,900 | $264,000 | $184,900 |
| 2024 | $4,271 | $411,100 | $247,500 | $163,600 |
| 2023 | $3,877 | $359,400 | $222,800 | $136,600 |
| 2022 | $3,877 | $299,400 | $189,800 | $109,600 |
| 2021 | $3,776 | $286,300 | $181,500 | $104,800 |
| 2020 | $3,422 | $256,700 | $156,800 | $99,900 |
| 2019 | $3,369 | $251,800 | $156,800 | $95,000 |
| 2018 | $3,367 | $251,800 | $156,800 | $95,000 |
| 2017 | $3,200 | $233,200 | $148,500 | $84,700 |
| 2016 | $3,291 | $237,100 | $140,300 | $96,800 |
| 2015 | $3,151 | $237,100 | $140,300 | $96,800 |
| 2014 | $3,058 | $230,100 | $140,300 | $89,800 |
Source: Public Records
Map
Nearby Homes
- 23 Reed St
- 19 Reed St
- 19 Red Pony Path Unit 19 D
- 23 Reed St
- 23 Reed St
- 23 Red Pony Path Unit 23 F
- 160 Island St
- 15 Reed St
- 156 Island St
- 15 Reed St
- 15 Reed St
- 15 Reed St Unit 15
- 15 Reed St Unit 1
- 16 Thomas St
- 30 Thomas St
- 16 Red Pony Path
- 16 Red Pony Path Unit 21 F
- 163 Island St
- 165 Ocean St
- 151 Ocean St