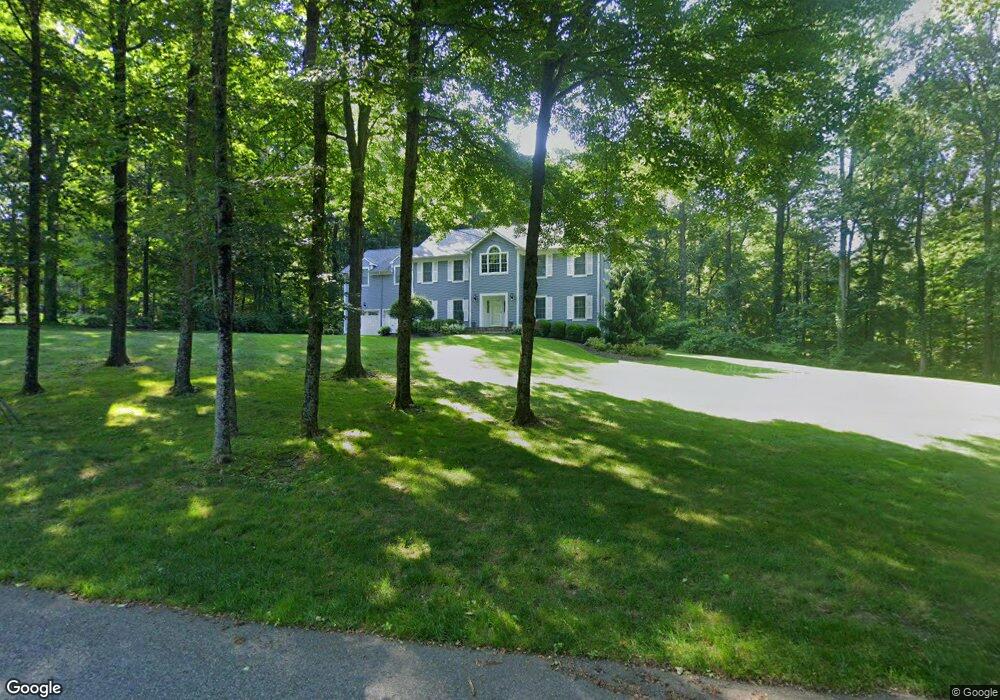
21 Robin Rd Woodbridge, CT 06525
Estimated Value: $882,201 - $978,000
4
Beds
4
Baths
3,604
Sq Ft
$258/Sq Ft
Est. Value
About This Home
This home is located at 21 Robin Rd, Woodbridge, CT 06525 and is currently estimated at $928,800, approximately $257 per square foot. 21 Robin Rd is a home located in New Haven County with nearby schools including Beecher Road Elementary School, Amity Middle School: Orange, and Amity Regional High School.
Ownership History
Date
Name
Owned For
Owner Type
Purchase Details
Closed on
Sep 11, 2013
Sold by
Ferbach Deborah S
Bought by
Fernbach Tr Deborah S and Bell Jonathan B
Current Estimated Value
Purchase Details
Closed on
Jul 3, 1995
Sold by
Yucker Shirley T and Yucker Robert H
Bought by
Fernbach Deborah S
Home Financials for this Owner
Home Financials are based on the most recent Mortgage that was taken out on this home.
Original Mortgage
$300,000
Interest Rate
7.8%
Mortgage Type
Purchase Money Mortgage
Create a Home Valuation Report for This Property
The Home Valuation Report is an in-depth analysis detailing your home's value as well as a comparison with similar homes in the area
Home Values in the Area
Average Home Value in this Area
Purchase History
| Date | Buyer | Sale Price | Title Company |
|---|---|---|---|
| Fernbach Tr Deborah S | -- | -- | |
| Fernbach Deborah S | $460,000 | -- |
Source: Public Records
Mortgage History
| Date | Status | Borrower | Loan Amount |
|---|---|---|---|
| Previous Owner | Fernbach Deborah S | $300,000 |
Source: Public Records
Tax History Compared to Growth
Tax History
| Year | Tax Paid | Tax Assessment Tax Assessment Total Assessment is a certain percentage of the fair market value that is determined by local assessors to be the total taxable value of land and additions on the property. | Land | Improvement |
|---|---|---|---|---|
| 2025 | $18,094 | $554,680 | $132,790 | $421,890 |
| 2024 | $16,641 | $358,400 | $138,180 | $220,220 |
| 2023 | $16,157 | $358,400 | $138,180 | $220,220 |
| 2022 | $15,687 | $358,400 | $138,180 | $220,220 |
| 2021 | $15,282 | $358,400 | $138,180 | $220,220 |
| 2020 | $14,884 | $358,400 | $138,180 | $220,220 |
| 2019 | $15,787 | $392,420 | $145,880 | $246,540 |
| 2018 | $15,630 | $392,420 | $145,880 | $246,540 |
| 2017 | $15,477 | $392,420 | $145,880 | $246,540 |
| 2016 | $15,124 | $392,420 | $145,880 | $246,540 |
| 2015 | $14,779 | $392,420 | $145,880 | $246,540 |
| 2014 | $13,985 | $399,910 | $161,910 | $238,000 |
Source: Public Records
Map
Nearby Homes
- 4 Brook Rd
- 1166 Old Racebrook Rd
- 24 Pleasant Hill Rd
- 71 Beecher Rd
- 54 Northrop Rd
- 6 Brookside Dr
- 10 Brookside Dr
- 46 Tumblebrook Rd
- 4 Stonewall Ln
- 54 Country Club Dr
- 51 Brookwood Dr
- 10 Hoinski Way
- 305 Rimmon Rd
- 2 Clifford Dr
- 5 Clifford Dr
- 827 Fountain St
- 5 Mohawk Ln
- 70 Woodfield Rd
- 27 Condon Dr
- 25 Glen Dr