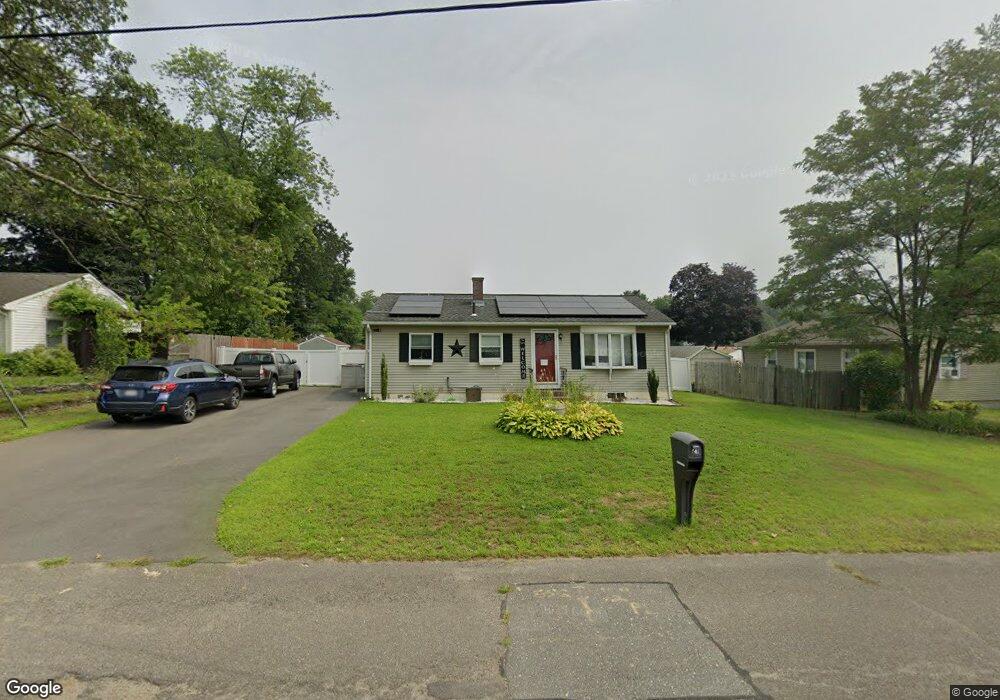
21 Ronald St Ludlow, MA 01056
Estimated Value: $296,000 - $317,000
2
Beds
1
Bath
988
Sq Ft
$312/Sq Ft
Est. Value
About This Home
This home is located at 21 Ronald St, Ludlow, MA 01056 and is currently estimated at $308,325, approximately $312 per square foot. 21 Ronald St is a home located in Hampden County with nearby schools including East Street Elementary School, Chapin Street Elementary School, and Paul R. Baird Middle School.
Ownership History
Date
Name
Owned For
Owner Type
Purchase Details
Closed on
Oct 27, 2025
Sold by
Suzor Charlene M
Bought by
Suzor Theodore A
Current Estimated Value
Home Financials for this Owner
Home Financials are based on the most recent Mortgage that was taken out on this home.
Original Mortgage
$309,802
Outstanding Balance
$309,802
Interest Rate
6.26%
Mortgage Type
Purchase Money Mortgage
Estimated Equity
-$1,477
Purchase Details
Closed on
Apr 8, 2020
Sold by
Zrakas Andrew T and Bousquet Kristen R
Bought by
Suzor Theodore A and Suzor Charlene M
Home Financials for this Owner
Home Financials are based on the most recent Mortgage that was taken out on this home.
Original Mortgage
$210,308
Interest Rate
3.2%
Mortgage Type
VA
Purchase Details
Closed on
Nov 9, 2018
Sold by
Bouyea Sylvia K Est and Dorval
Bought by
Zrakas Andrew T and Bousquet Kristen R
Home Financials for this Owner
Home Financials are based on the most recent Mortgage that was taken out on this home.
Original Mortgage
$139,971
Interest Rate
4.7%
Mortgage Type
New Conventional
Purchase Details
Closed on
Aug 6, 1965
Bought by
Bouyea Robert N and Bouyea Sylvia K
Create a Home Valuation Report for This Property
The Home Valuation Report is an in-depth analysis detailing your home's value as well as a comparison with similar homes in the area
Home Values in the Area
Average Home Value in this Area
Purchase History
| Date | Buyer | Sale Price | Title Company |
|---|---|---|---|
| Suzor Theodore A | $50,000 | Vantage Point Title | |
| Suzor Theodore A | $207,600 | None Available | |
| Suzor Theodore A | $207,600 | None Available | |
| Zrakas Andrew T | $144,300 | -- | |
| Zrakas Andrew T | $144,300 | -- | |
| Bouyea Robert N | $11,500 | -- |
Source: Public Records
Mortgage History
| Date | Status | Borrower | Loan Amount |
|---|---|---|---|
| Open | Suzor Theodore A | $309,802 | |
| Previous Owner | Suzor Theodore A | $210,308 | |
| Previous Owner | Zrakas Andrew T | $139,971 | |
| Previous Owner | Bouyea Robert N | $15,000 | |
| Previous Owner | Bouyea Robert N | $10,000 |
Source: Public Records
Tax History Compared to Growth
Tax History
| Year | Tax Paid | Tax Assessment Tax Assessment Total Assessment is a certain percentage of the fair market value that is determined by local assessors to be the total taxable value of land and additions on the property. | Land | Improvement |
|---|---|---|---|---|
| 2025 | $5,120 | $295,100 | $70,400 | $224,700 |
| 2024 | $4,848 | $268,000 | $70,400 | $197,600 |
| 2023 | $4,472 | $229,200 | $58,500 | $170,700 |
| 2022 | $4,216 | $210,900 | $58,500 | $152,400 |
| 2021 | $4,203 | $199,400 | $58,500 | $140,900 |
| 2020 | $2,961 | $143,600 | $57,600 | $86,000 |
| 2019 | $2,743 | $138,400 | $57,100 | $81,300 |
| 2018 | $2,601 | $136,800 | $57,100 | $79,700 |
| 2017 | $2,589 | $139,700 | $58,100 | $81,600 |
| 2016 | $2,520 | $139,000 | $60,300 | $78,700 |
| 2015 | $2,388 | $138,100 | $59,700 | $78,400 |
Source: Public Records
Map
Nearby Homes
- 201 Main St
- 166-168 Main St
- 298 Main St
- 295 Main St
- 1200 Worcester St
- 33 Grimard St
- 96 Lyons St
- 20 Connolly St
- 34-36 Mazarin St
- 189 Essex St Unit H
- 0 Fuller St Unit 73409741
- 70 Fuller St
- 25 Burke St
- 105 Mazarin St
- 27 Goodwin St
- 84 Fuller St Unit 1
- 42 Roy St
- 58 Mariana Ln
- 0 Center St Unit 73415933
- 0 Parker St (Ws) Unit 73388310