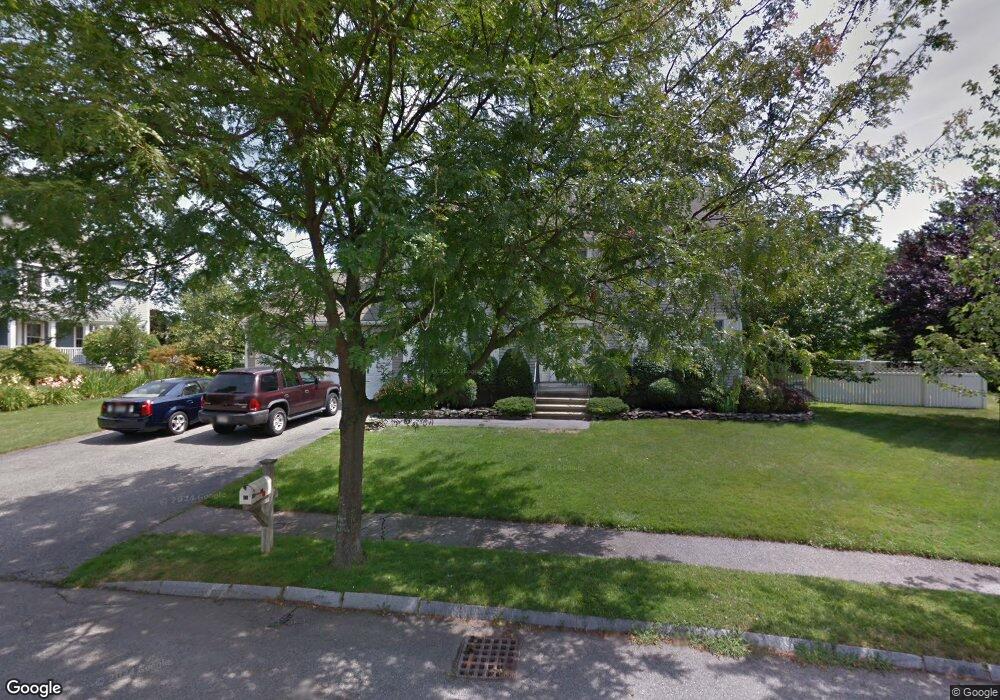
21 Rose Farm Ln Woburn, MA 01801
Downtown Woburn NeighborhoodEstimated Value: $991,595 - $1,237,000
4
Beds
3
Baths
2,080
Sq Ft
$541/Sq Ft
Est. Value
About This Home
This home is located at 21 Rose Farm Ln, Woburn, MA 01801 and is currently estimated at $1,125,649, approximately $541 per square foot. 21 Rose Farm Ln is a home located in Middlesex County with nearby schools including Wyman Elementary School, John F. Kennedy Middle School, and Woburn High School.
Ownership History
Date
Name
Owned For
Owner Type
Purchase Details
Closed on
Feb 23, 2016
Sold by
Parziale Timothy and Parziale Kimberly M
Bought by
Parziale Kimberly M and Fagan David M
Current Estimated Value
Purchase Details
Closed on
Oct 1, 1997
Sold by
Melanson Dev Grp Inc
Bought by
Furman Jeffrey S and Prem Rossana L
Home Financials for this Owner
Home Financials are based on the most recent Mortgage that was taken out on this home.
Original Mortgage
$246,370
Interest Rate
7.41%
Mortgage Type
Purchase Money Mortgage
Create a Home Valuation Report for This Property
The Home Valuation Report is an in-depth analysis detailing your home's value as well as a comparison with similar homes in the area
Home Values in the Area
Average Home Value in this Area
Purchase History
| Date | Buyer | Sale Price | Title Company |
|---|---|---|---|
| Parziale Kimberly M | -- | -- | |
| Parziale Kimberly M | -- | -- | |
| Furman Jeffrey S | $289,847 | -- |
Source: Public Records
Mortgage History
| Date | Status | Borrower | Loan Amount |
|---|---|---|---|
| Previous Owner | Furman Jeffrey S | $215,000 | |
| Previous Owner | Furman Jeffrey S | $170,000 | |
| Previous Owner | Furman Jeffrey S | $246,370 |
Source: Public Records
Tax History Compared to Growth
Tax History
| Year | Tax Paid | Tax Assessment Tax Assessment Total Assessment is a certain percentage of the fair market value that is determined by local assessors to be the total taxable value of land and additions on the property. | Land | Improvement |
|---|---|---|---|---|
| 2025 | $8,246 | $965,600 | $418,200 | $547,400 |
| 2024 | $7,460 | $925,500 | $398,300 | $527,200 |
| 2023 | $7,282 | $837,000 | $362,100 | $474,900 |
| 2022 | $7,111 | $761,300 | $314,900 | $446,400 |
| 2021 | $6,830 | $732,000 | $299,900 | $432,100 |
| 2020 | $6,579 | $705,900 | $299,900 | $406,000 |
| 2019 | $6,346 | $668,000 | $285,600 | $382,400 |
| 2018 | $6,173 | $624,200 | $272,500 | $351,700 |
| 2017 | $5,740 | $577,500 | $259,600 | $317,900 |
| 2016 | $5,488 | $546,100 | $242,600 | $303,500 |
| 2015 | $5,293 | $520,500 | $226,700 | $293,800 |
| 2014 | $5,399 | $517,100 | $244,100 | $273,000 |
Source: Public Records
Map
Nearby Homes
- 17 Wright St
- 18 Hamilton Rd
- 462 Place Ln
- 166 Place Ln Unit 166
- 168 Place Ln
- 12 Cassidy Dr
- 37 1/2 Chestnut St
- 8 Clinton St
- 26 Flagg St
- 602 Main St Unit 1
- 12 Mishawum Rd
- 4 Ardmore Ave
- 21 Franklin St
- 14 Church Ave
- 14 Church Ave Unit 2
- 18 Church St Unit 2
- 11 Hovey St
- 29 Overlook Ave
- 0 Fryeburg Rd
- 477 Main St