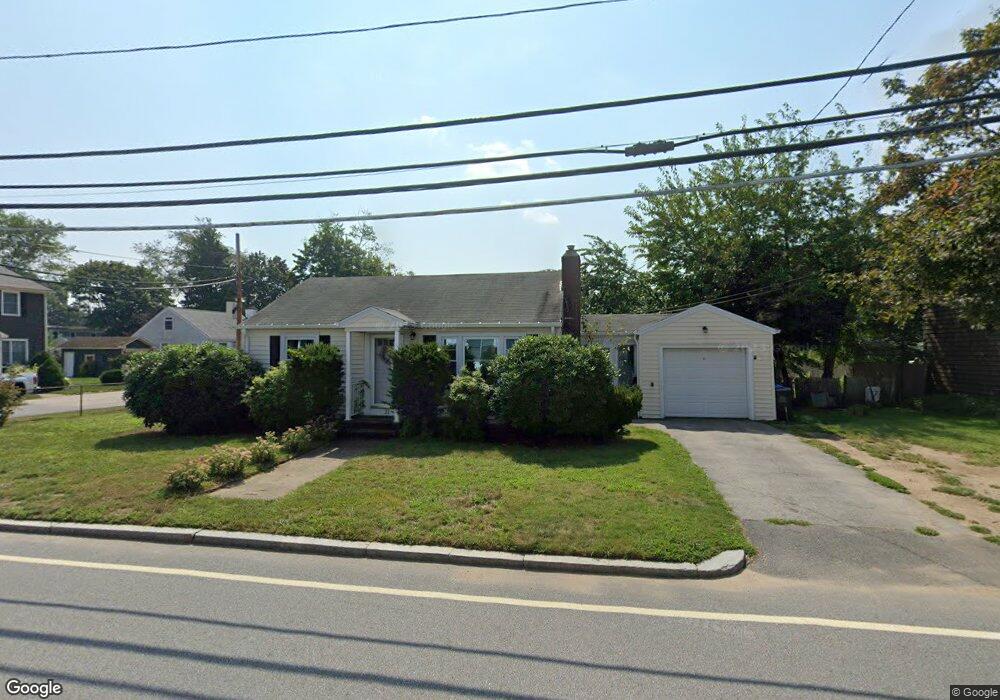
21 Rounds Ave Riverside, RI 02915
Riverside NeighborhoodEstimated Value: $396,707 - $452,000
2
Beds
1
Bath
1,080
Sq Ft
$396/Sq Ft
Est. Value
About This Home
This home is located at 21 Rounds Ave, Riverside, RI 02915 and is currently estimated at $427,677, approximately $395 per square foot. 21 Rounds Ave is a home located in Providence County with nearby schools including East Providence High School, St Luke Elementary School, and St Mary Academy-Bay View.
Ownership History
Date
Name
Owned For
Owner Type
Purchase Details
Closed on
Nov 30, 2010
Sold by
Gasbarro William P
Bought by
Zinni John N
Current Estimated Value
Home Financials for this Owner
Home Financials are based on the most recent Mortgage that was taken out on this home.
Original Mortgage
$98,800
Outstanding Balance
$64,865
Interest Rate
4.25%
Mortgage Type
Purchase Money Mortgage
Estimated Equity
$362,812
Create a Home Valuation Report for This Property
The Home Valuation Report is an in-depth analysis detailing your home's value as well as a comparison with similar homes in the area
Home Values in the Area
Average Home Value in this Area
Purchase History
| Date | Buyer | Sale Price | Title Company |
|---|---|---|---|
| Zinni John N | $123,500 | -- | |
| Zinni John N | $123,500 | -- |
Source: Public Records
Mortgage History
| Date | Status | Borrower | Loan Amount |
|---|---|---|---|
| Open | Zinni John N | $98,800 | |
| Closed | Zinni John N | $98,800 |
Source: Public Records
Tax History
| Year | Tax Paid | Tax Assessment Tax Assessment Total Assessment is a certain percentage of the fair market value that is determined by local assessors to be the total taxable value of land and additions on the property. | Land | Improvement |
|---|---|---|---|---|
| 2025 | $4,563 | $349,100 | $118,400 | $230,700 |
| 2024 | $4,272 | $278,700 | $98,700 | $180,000 |
| 2023 | $4,114 | $278,700 | $98,700 | $180,000 |
| 2022 | $3,624 | $165,800 | $53,900 | $111,900 |
| 2021 | $3,565 | $165,800 | $53,900 | $111,900 |
| 2020 | $3,414 | $165,800 | $53,900 | $111,900 |
| 2019 | $3,319 | $165,800 | $53,900 | $111,900 |
| 2018 | $3,215 | $140,500 | $52,400 | $88,100 |
| 2017 | $3,143 | $140,500 | $52,400 | $88,100 |
| 2016 | $3,128 | $140,500 | $52,400 | $88,100 |
| 2015 | $2,981 | $129,900 | $48,500 | $81,400 |
| 2014 | $2,981 | $129,900 | $48,500 | $81,400 |
Source: Public Records
Map
Nearby Homes
- 14 Benedict St
- 14 Winthrop St
- 85 Hilton Ave
- 103 Burnside Ave
- 15 Claire St
- 23 Albert Ave
- 25 Arnold St
- 151 Willett Ave Unit 2
- 33 Pine St Unit 35
- 85 Hospital Rd
- 6 Hazelton Rd
- 56 Knowlton St
- 41 White Ave
- 28 Jefferson Ave
- 45 Washington Rd
- 65 Estrell Dr
- 0 Carousel Dr
- 43 Bullocks Point Ave Unit 4A
- 25 Bullocks Point Ave Unit 5C
- 33 Bullocks Point Ave Unit 5C
Your Personal Tour Guide
Ask me questions while you tour the home.