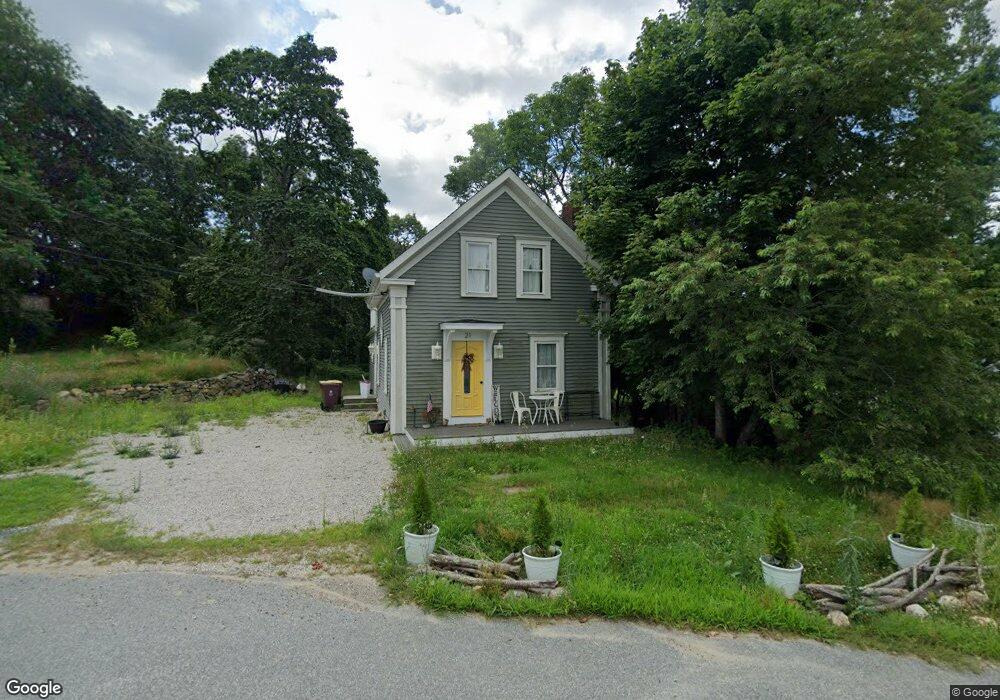
21 Russell St Acushnet, MA 02743
Estimated Value: $376,000 - $463,000
3
Beds
1
Bath
813
Sq Ft
$508/Sq Ft
Est. Value
About This Home
This home is located at 21 Russell St, Acushnet, MA 02743 and is currently estimated at $412,688, approximately $507 per square foot. 21 Russell St is a home located in Bristol County with nearby schools including Acushnet Elementary School, Albert F Ford Middle School, and Alma Del Mar Charter School.
Ownership History
Date
Name
Owned For
Owner Type
Purchase Details
Closed on
Feb 24, 2015
Sold by
Robinson Timothy P and Robinson Jeannette
Bought by
Robinson Jeannette
Current Estimated Value
Purchase Details
Closed on
Aug 12, 2011
Sold by
Robinson Jeanette
Bought by
Robinson Timothy P and Robinson Jeanette
Home Financials for this Owner
Home Financials are based on the most recent Mortgage that was taken out on this home.
Original Mortgage
$70,000
Interest Rate
4.51%
Mortgage Type
Purchase Money Mortgage
Purchase Details
Closed on
Sep 9, 2010
Sold by
Citimortgage Inc
Bought by
Department Of Housing & Urban Dev
Purchase Details
Closed on
Aug 17, 2010
Sold by
Kingsley Keith A and Citimortgage Inc
Bought by
Citimortgage Inc
Purchase Details
Closed on
Jul 25, 2000
Sold by
Desroches Conrad R and Desroches Roland J
Bought by
Kingsley Keith A and Kingsley Wendy
Create a Home Valuation Report for This Property
The Home Valuation Report is an in-depth analysis detailing your home's value as well as a comparison with similar homes in the area
Home Values in the Area
Average Home Value in this Area
Purchase History
| Date | Buyer | Sale Price | Title Company |
|---|---|---|---|
| Robinson Jeannette | -- | -- | |
| Robinson Timothy P | -- | -- | |
| Robinson Jeanette | $110,000 | -- | |
| Department Of Housing & Urban Dev | -- | -- | |
| Citimortgage Inc | $252,214 | -- | |
| Kingsley Keith A | $110,000 | -- |
Source: Public Records
Mortgage History
| Date | Status | Borrower | Loan Amount |
|---|---|---|---|
| Previous Owner | Robinson Jeanette | $70,000 | |
| Previous Owner | Kingsley Keith A | $216,702 | |
| Previous Owner | Kingsley Keith A | $140,000 |
Source: Public Records
Tax History Compared to Growth
Tax History
| Year | Tax Paid | Tax Assessment Tax Assessment Total Assessment is a certain percentage of the fair market value that is determined by local assessors to be the total taxable value of land and additions on the property. | Land | Improvement |
|---|---|---|---|---|
| 2025 | $36 | $330,900 | $98,100 | $232,800 |
| 2024 | $3,489 | $305,800 | $93,800 | $212,000 |
| 2023 | $3,292 | $274,300 | $85,300 | $189,000 |
| 2022 | $3,381 | $254,800 | $81,000 | $173,800 |
| 2021 | $3,081 | $222,800 | $81,000 | $141,800 |
| 2020 | $3,106 | $222,800 | $81,000 | $141,800 |
| 2019 | $2,998 | $211,400 | $81,000 | $130,400 |
| 2018 | $2,920 | $202,500 | $81,000 | $121,500 |
| 2017 | $2,809 | $194,500 | $81,000 | $113,500 |
| 2016 | $2,679 | $184,400 | $81,000 | $103,400 |
| 2015 | $2,633 | $184,400 | $81,000 | $103,400 |
Source: Public Records
Map
Nearby Homes