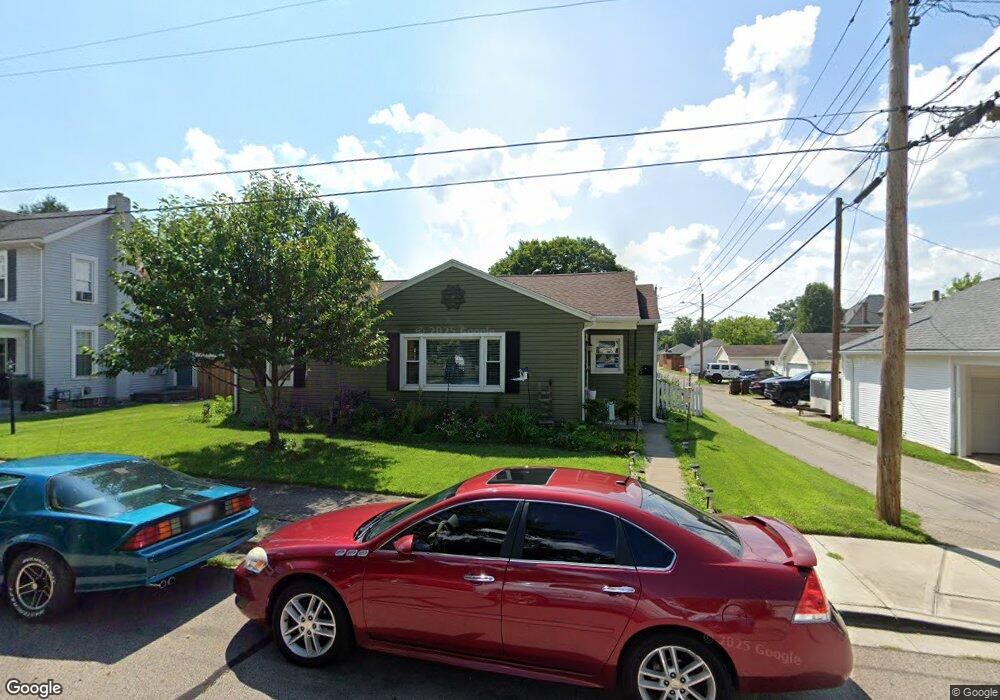
21 S 9th St Miamisburg, OH 45342
Downtown Miamisburg NeighborhoodEstimated Value: $175,000 - $202,000
3
Beds
1
Bath
1,060
Sq Ft
$180/Sq Ft
Est. Value
About This Home
This home is located at 21 S 9th St, Miamisburg, OH 45342 and is currently estimated at $191,192, approximately $180 per square foot. 21 S 9th St is a home located in Montgomery County with nearby schools including Miamisburg High School and Bethel Baptist School.
Ownership History
Date
Name
Owned For
Owner Type
Purchase Details
Closed on
Apr 23, 2019
Sold by
Park Kevin M and Park Angela Marie
Bought by
Volk Edward and Volk Julie
Current Estimated Value
Home Financials for this Owner
Home Financials are based on the most recent Mortgage that was taken out on this home.
Original Mortgage
$109,800
Outstanding Balance
$96,337
Interest Rate
4.2%
Mortgage Type
New Conventional
Estimated Equity
$94,855
Purchase Details
Closed on
Dec 14, 2012
Sold by
Roe Gary W and Greenlee Gloria J
Bought by
Park Kevin M
Home Financials for this Owner
Home Financials are based on the most recent Mortgage that was taken out on this home.
Original Mortgage
$78,300
Interest Rate
3.38%
Mortgage Type
Future Advance Clause Open End Mortgage
Create a Home Valuation Report for This Property
The Home Valuation Report is an in-depth analysis detailing your home's value as well as a comparison with similar homes in the area
Home Values in the Area
Average Home Value in this Area
Purchase History
| Date | Buyer | Sale Price | Title Company |
|---|---|---|---|
| Volk Edward | $122,000 | Landmark Ttl Agcy South Inc | |
| Park Kevin M | $87,000 | Sterling Title Inc |
Source: Public Records
Mortgage History
| Date | Status | Borrower | Loan Amount |
|---|---|---|---|
| Open | Volk Edward | $109,800 | |
| Previous Owner | Park Kevin M | $78,300 |
Source: Public Records
Tax History Compared to Growth
Tax History
| Year | Tax Paid | Tax Assessment Tax Assessment Total Assessment is a certain percentage of the fair market value that is determined by local assessors to be the total taxable value of land and additions on the property. | Land | Improvement |
|---|---|---|---|---|
| 2024 | $3,392 | $53,350 | $10,330 | $43,020 |
| 2023 | $3,392 | $53,350 | $10,330 | $43,020 |
| 2022 | $2,740 | $36,280 | $7,020 | $29,260 |
| 2021 | $2,425 | $36,280 | $7,020 | $29,260 |
| 2020 | $2,423 | $36,280 | $7,020 | $29,260 |
| 2019 | $1,518 | $20,780 | $4,680 | $16,100 |
| 2018 | $1,523 | $20,780 | $4,680 | $16,100 |
| 2017 | $1,513 | $20,780 | $4,680 | $16,100 |
| 2016 | $1,388 | $18,310 | $4,680 | $13,630 |
| 2015 | $1,386 | $18,310 | $4,680 | $13,630 |
| 2014 | $1,358 | $18,310 | $4,680 | $13,630 |
| 2012 | -- | $27,250 | $9,000 | $18,250 |
Source: Public Records
Map
Nearby Homes
- 740 E Central Ave
- 736 Park Ave
- 607 E Central Ave
- 1039 E Central Ave
- 806 E Sycamore St
- 619 Jefferson St
- 1102 E Lindsey Ave
- 1137 E Pearl St
- 425 Early Dr W
- 948 Kercher St
- 1196 E Linden Ave
- 513 Mound Ave
- 630 N 11th St
- 42 S Main St
- 233 Woodridge Dr
- 747 Loop St
- 150 S Main St
- 111 S Main St
- 1121 Dayket Cir
- 111 Old Main St