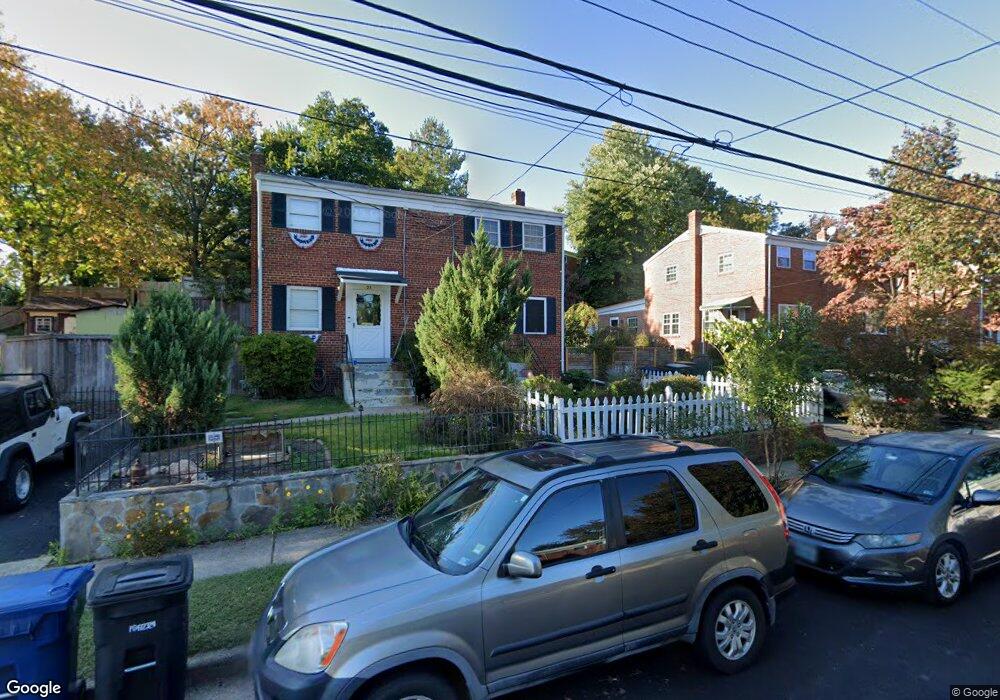
21 S Ingram St Alexandria, VA 22304
Seminary Hill NeighborhoodEstimated Value: $492,000 - $530,000
--
Bed
1
Bath
864
Sq Ft
$592/Sq Ft
Est. Value
About This Home
This home is located at 21 S Ingram St, Alexandria, VA 22304 and is currently estimated at $511,095, approximately $591 per square foot. 21 S Ingram St is a home located in Alexandria City with nearby schools including Patrick Henry Elementary School, Alexandria City High School, and Bishop Ireton High School.
Ownership History
Date
Name
Owned For
Owner Type
Purchase Details
Closed on
Nov 1, 2016
Sold by
Short Koa
Bought by
Deshong-Rojos Sara R and Deshong-Rojos Omar Rojas
Current Estimated Value
Home Financials for this Owner
Home Financials are based on the most recent Mortgage that was taken out on this home.
Original Mortgage
$318,500
Interest Rate
3.42%
Mortgage Type
Adjustable Rate Mortgage/ARM
Purchase Details
Closed on
Sep 15, 2004
Sold by
Freeman Bertina
Bought by
Short Koa
Home Financials for this Owner
Home Financials are based on the most recent Mortgage that was taken out on this home.
Original Mortgage
$212,000
Interest Rate
5.89%
Mortgage Type
New Conventional
Purchase Details
Closed on
Jan 10, 1995
Sold by
Mancini Daurie G
Bought by
Freeman Bertina M
Home Financials for this Owner
Home Financials are based on the most recent Mortgage that was taken out on this home.
Original Mortgage
$97,393
Interest Rate
9.23%
Create a Home Valuation Report for This Property
The Home Valuation Report is an in-depth analysis detailing your home's value as well as a comparison with similar homes in the area
Home Values in the Area
Average Home Value in this Area
Purchase History
| Date | Buyer | Sale Price | Title Company |
|---|---|---|---|
| Deshong-Rojos Sara R | -- | Premier Title | |
| Deshong-Rojos Sara R | $318,500 | Premier Title Inc | |
| Short Koa | $265,000 | -- | |
| Freeman Bertina M | $98,000 | -- |
Source: Public Records
Mortgage History
| Date | Status | Borrower | Loan Amount |
|---|---|---|---|
| Previous Owner | Deshong-Rojos Sara R | $318,500 | |
| Previous Owner | Short Koa | $212,000 | |
| Previous Owner | Freeman Bertina M | $97,393 |
Source: Public Records
Tax History Compared to Growth
Tax History
| Year | Tax Paid | Tax Assessment Tax Assessment Total Assessment is a certain percentage of the fair market value that is determined by local assessors to be the total taxable value of land and additions on the property. | Land | Improvement |
|---|---|---|---|---|
| 2025 | $5,461 | $449,235 | $224,000 | $225,235 |
| 2024 | $5,461 | $425,398 | $213,000 | $212,398 |
| 2023 | $4,567 | $411,396 | $206,000 | $205,396 |
| 2022 | $4,358 | $392,609 | $196,400 | $196,209 |
| 2021 | $4,149 | $373,753 | $187,000 | $186,753 |
| 2020 | $4,423 | $357,541 | $178,000 | $179,541 |
| 2019 | $3,866 | $342,161 | $171,000 | $171,161 |
| 2018 | $3,756 | $332,373 | $166,000 | $166,373 |
| 2017 | $3,533 | $312,671 | $161,200 | $151,471 |
| 2016 | $3,112 | $289,988 | $155,000 | $134,988 |
| 2015 | $3,025 | $289,988 | $155,000 | $134,988 |
| 2014 | $2,977 | $285,387 | $155,000 | $130,387 |
Source: Public Records
Map
Nearby Homes
- 33 Underwood Place
- 28 Garden Dr
- 4600 Duke St Unit 921
- 4600 Duke St Unit 431
- 4600 Duke St Unit 1121
- 4600 Duke St Unit 1300
- 4600 Duke St Unit 603
- 4600 Duke St Unit 432
- 4600 Duke St Unit 620
- 4600 Duke St Unit 613
- 4600 Duke St Unit 723
- 4600 Duke St Unit 803
- 3811 Usher Ct
- 132 N Early St
- 4600 Strathblane Place
- 3816 Usher Ct
- 803 N Howard St Unit 152
- 803 N Howard St Unit 254
- 803 N Howard St Unit 252
- 491 N Latham St
- 23 S Ingram St
- 19 S Ingram St
- 17 S Ingram St
- 25 S Ingram St
- 28 Underwood Place
- 15 S Ingram St
- 27 S Ingram St
- 30 Underwood Place
- 26 Underwood Place
- 13 S Ingram St
- 32 Underwood Place
- 34 Underwood Place
- 11 S Ingram St
- 22 S Ingram St
- 24 S Ingram St
- 20 S Ingram St
- 26 S Ingram St
- 36 Underwood Place
- 9 S Ingram St
- 38 Underwood Place