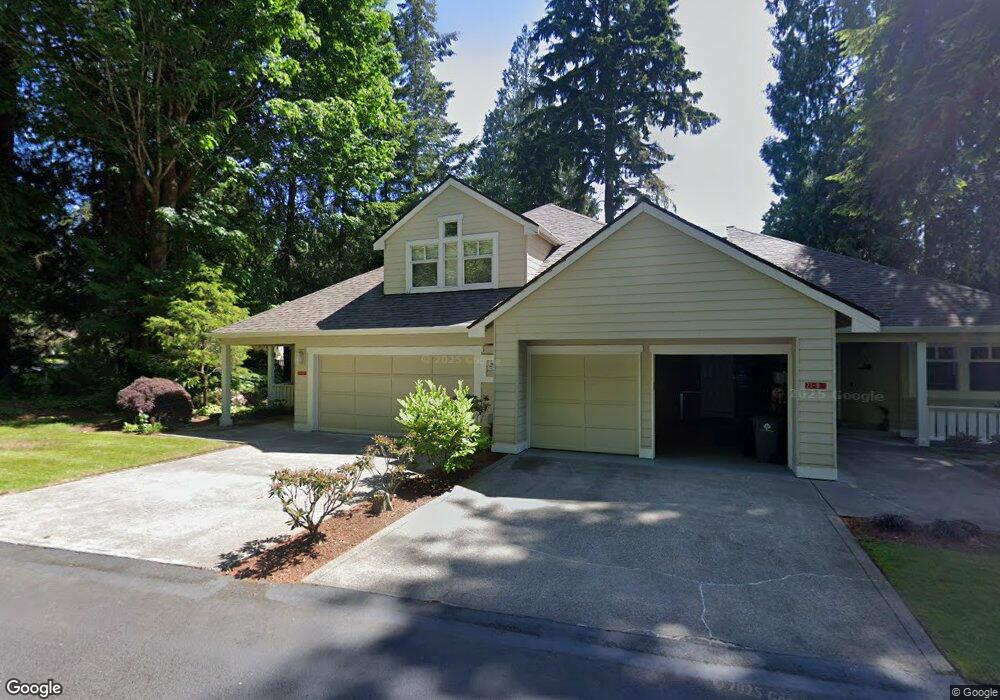
21 S Keel Way Port Ludlow, WA 98365
Port Ludlow NeighborhoodEstimated Value: $554,000 - $642,000
--
Bed
--
Bath
1,610
Sq Ft
$381/Sq Ft
Est. Value
About This Home
This home is located at 21 S Keel Way, Port Ludlow, WA 98365 and is currently estimated at $612,954, approximately $380 per square foot. 21 S Keel Way is a home located in Jefferson County with nearby schools including Chimacum Creek Primary School, Chimacum School Pi Program, and Chimacum Elementary School.
Ownership History
Date
Name
Owned For
Owner Type
Purchase Details
Closed on
Aug 28, 2025
Sold by
Connolly Family Trust and Connolly John Paul
Bought by
Fuller Carol
Current Estimated Value
Home Financials for this Owner
Home Financials are based on the most recent Mortgage that was taken out on this home.
Original Mortgage
$190,000
Outstanding Balance
$190,000
Interest Rate
6.74%
Mortgage Type
New Conventional
Estimated Equity
$422,954
Purchase Details
Closed on
Jun 26, 2024
Sold by
Drew Patricia Ann and Kenyon Lori Ann
Bought by
Connolly Family Trust and Connolly
Purchase Details
Closed on
Dec 1, 2016
Sold by
Nelson Henry K and Nelson Margaret J
Bought by
Drew Patricia Ann and Kenyon Lori Ann
Home Financials for this Owner
Home Financials are based on the most recent Mortgage that was taken out on this home.
Original Mortgage
$259,000
Interest Rate
3.52%
Mortgage Type
New Conventional
Purchase Details
Closed on
Dec 1, 2009
Sold by
Holtman Maxine
Bought by
Nelson Margaret and Nelson Henry K
Purchase Details
Closed on
Nov 24, 2009
Sold by
Nelson Margaret and Nelson Henry K
Bought by
Nelson Henry K and Nelson Margaret J
Purchase Details
Closed on
Jan 3, 2004
Sold by
Bowen Kathryn E
Bought by
Holtman Maxine
Create a Home Valuation Report for This Property
The Home Valuation Report is an in-depth analysis detailing your home's value as well as a comparison with similar homes in the area
Home Values in the Area
Average Home Value in this Area
Purchase History
| Date | Buyer | Sale Price | Title Company |
|---|---|---|---|
| Fuller Carol | $637,000 | Horizon Title Group | |
| Connolly Family Trust | $600,000 | Horizon Title Group | |
| Drew Patricia Ann | $279,000 | First American Title | |
| Nelson Margaret | $255,000 | None Available | |
| Nelson Henry K | -- | None Available | |
| Holtman Maxine | $250,000 | First American Title |
Source: Public Records
Mortgage History
| Date | Status | Borrower | Loan Amount |
|---|---|---|---|
| Open | Fuller Carol | $190,000 | |
| Previous Owner | Drew Patricia Ann | $259,000 |
Source: Public Records
Tax History Compared to Growth
Tax History
| Year | Tax Paid | Tax Assessment Tax Assessment Total Assessment is a certain percentage of the fair market value that is determined by local assessors to be the total taxable value of land and additions on the property. | Land | Improvement |
|---|---|---|---|---|
| 2024 | $3,510 | $464,200 | $110,000 | $354,200 |
| 2023 | $3,510 | $448,100 | $110,000 | $338,100 |
| 2022 | $2,905 | $423,950 | $110,000 | $313,950 |
| 2021 | $2,860 | $320,085 | $81,000 | $239,085 |
| 2020 | $2,722 | $296,375 | $75,000 | $221,375 |
| 2019 | $2,585 | $272,665 | $69,000 | $203,665 |
| 2018 | $2,653 | $260,810 | $66,000 | $194,810 |
| 2017 | $2,261 | $237,100 | $60,000 | $177,100 |
| 2016 | $2,216 | $207,100 | $30,000 | $177,100 |
| 2015 | $2,024 | $199,050 | $30,000 | $169,050 |
| 2014 | -- | $184,475 | $27,500 | $156,975 |
| 2013 | -- | $184,475 | $27,500 | $156,975 |
Source: Public Records
Map
Nearby Homes
- 41 S Keel Way Unit B
- 61 S Keel Way
- 60 N Keel Way Unit C
- 91 N Chandler Ct Unit D
- 103 Heritage Ln
- 150 Ebb Tide Ct
- 111 N Bay Ln Unit 1
- 20 Bluebird Ln
- 181 N Bay Ln Unit 6
- 103 Wells Ridge Ct
- 70 Fernridge Ln
- 53 Dunsmuir Rd
- 639 Rainier Ln
- 36 Dunbar Ct Unit Ct
- 91 Drew Ln
- 192 Highland Dr
- 999 Highland Dr
- 101 Highland Green Unit 5
- 101 Highland Green Unit 1
- 171 Highland Dr Unit Drive
- 21 S Keel Way Unit 16B
- 21 S Keel Way Unit 16A
- 21 S Keel Way
- 41 S Keel Way Unit A
- 41 S Keel Way
- 41 S Keel Way
- 10 S Chandler Ct
- 10 S Chandler Ct
- 10 S Chandler Ct Unit A
- 30 S Chandler Court Ct S Unit 30-B
- 30 S Chandler Ct Unit 9-A
- 30 S Chandler Ct Unit A
- 30 S Chandler Ct
- 30 S Chandler Ct
- 30 S Chandler Ct Unit B
- 50 -B S Chandler Ct
- 81 S Keel Way
- 50 S Chandler Ct Unit D