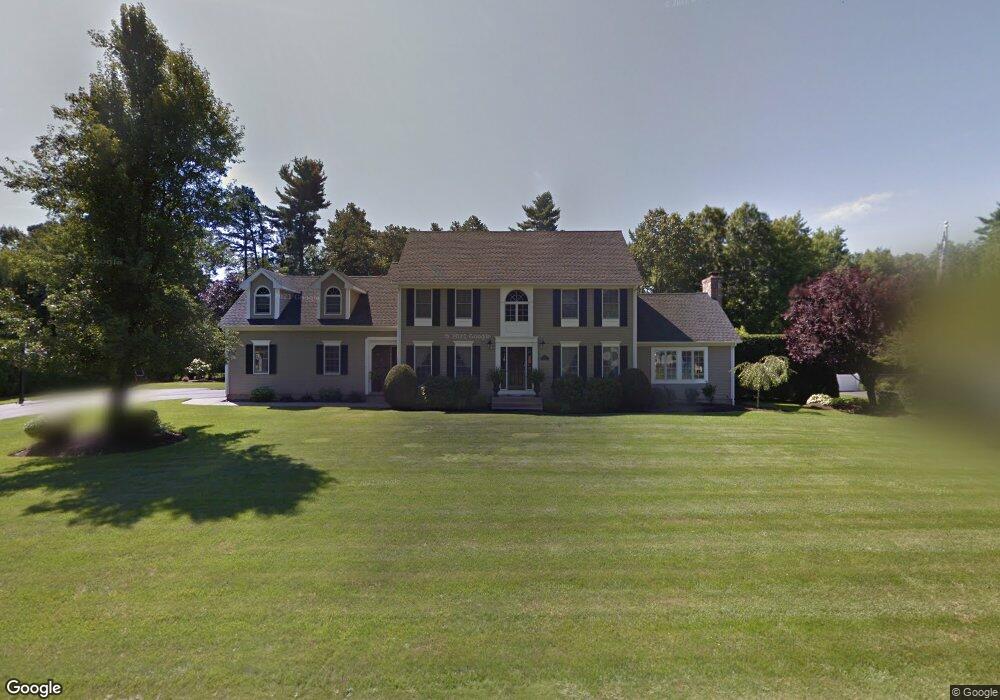
21 Salvator Dr Westfield, MA 01085
Estimated Value: $668,618 - $765,000
4
Beds
4
Baths
3,082
Sq Ft
$226/Sq Ft
Est. Value
About This Home
This home is located at 21 Salvator Dr, Westfield, MA 01085 and is currently estimated at $695,905, approximately $225 per square foot. 21 Salvator Dr is a home located in Hampden County with nearby schools including Westfield High School and Saint Mary High School.
Ownership History
Date
Name
Owned For
Owner Type
Purchase Details
Closed on
Jun 29, 2007
Sold by
Lyons James J and Lyons Lisa M
Bought by
Visconti Christine S and Visconti Gary J
Current Estimated Value
Home Financials for this Owner
Home Financials are based on the most recent Mortgage that was taken out on this home.
Original Mortgage
$200,000
Interest Rate
6.24%
Mortgage Type
Purchase Money Mortgage
Purchase Details
Closed on
Mar 22, 1991
Sold by
Bergeron Marc T and Bergeron Suzanne M
Bought by
Lyons James J and Lyons Lisa M
Create a Home Valuation Report for This Property
The Home Valuation Report is an in-depth analysis detailing your home's value as well as a comparison with similar homes in the area
Home Values in the Area
Average Home Value in this Area
Purchase History
| Date | Buyer | Sale Price | Title Company |
|---|---|---|---|
| Visconti Christine S | $445,000 | -- | |
| Lyons James J | $225,000 | -- |
Source: Public Records
Mortgage History
| Date | Status | Borrower | Loan Amount |
|---|---|---|---|
| Open | Lyons James J | $50,000 | |
| Open | Lyons James J | $200,000 | |
| Closed | Visconti Christine S | $200,000 | |
| Previous Owner | Lyons James J | $35,000 |
Source: Public Records
Tax History Compared to Growth
Tax History
| Year | Tax Paid | Tax Assessment Tax Assessment Total Assessment is a certain percentage of the fair market value that is determined by local assessors to be the total taxable value of land and additions on the property. | Land | Improvement |
|---|---|---|---|---|
| 2025 | $8,429 | $555,300 | $156,400 | $398,900 |
| 2024 | $8,477 | $530,800 | $142,400 | $388,400 |
| 2023 | $8,063 | $491,000 | $135,200 | $355,800 |
| 2022 | $8,063 | $436,100 | $120,800 | $315,300 |
| 2021 | $7,822 | $414,300 | $113,600 | $300,700 |
| 2020 | $7,685 | $399,200 | $113,600 | $285,600 |
| 2019 | $7,536 | $383,100 | $108,800 | $274,300 |
| 2018 | $7,417 | $383,100 | $108,800 | $274,300 |
| 2017 | $7,248 | $373,200 | $110,000 | $263,200 |
| 2016 | $7,255 | $373,200 | $110,000 | $263,200 |
| 2015 | $6,750 | $364,100 | $110,000 | $254,100 |
| 2014 | $5,055 | $364,100 | $110,000 | $254,100 |
Source: Public Records
Map
Nearby Homes
- 120 Woodcliff Dr
- 242 Eastwood Dr
- 162 Joseph Ave
- 244 Union St
- 0 Holyoke Rd
- 846 E Mountain Rd
- 315 Holyoke Rd
- 119 Union St Unit 4
- 243 Holyoke Rd
- 0 E Mountain Rd
- 189 Springfield Rd Unit 23
- 99 Woodmont St
- 13 William St
- 0 Feeding Hills Rd
- 103 Feeding Hills Rd
- 351 N Elm St
- 28 Union St
- 4 Columbia St
- 30 Cross St
- 25 White St
- 15 Salvator Dr
- 29 Salvator Dr
- 16 Christopher Dr
- 12 Christopher Dr
- 22 Christopher Dr
- 20 Salvator Dr
- 51 Marla Cir
- 6 Christopher Dr
- 28 Christopher Dr
- 37 Salvator Dr
- 5 Salvator Dr
- 12 Salvator Dr
- 75 Woodcliff Dr
- 52 Briarcliff Dr
- 35 Marla Cir
- 15 Christopher Dr
- 11 Christopher Dr
- 32 Christopher Dr
- 21 Marla Cir
- 41 Salvator Dr