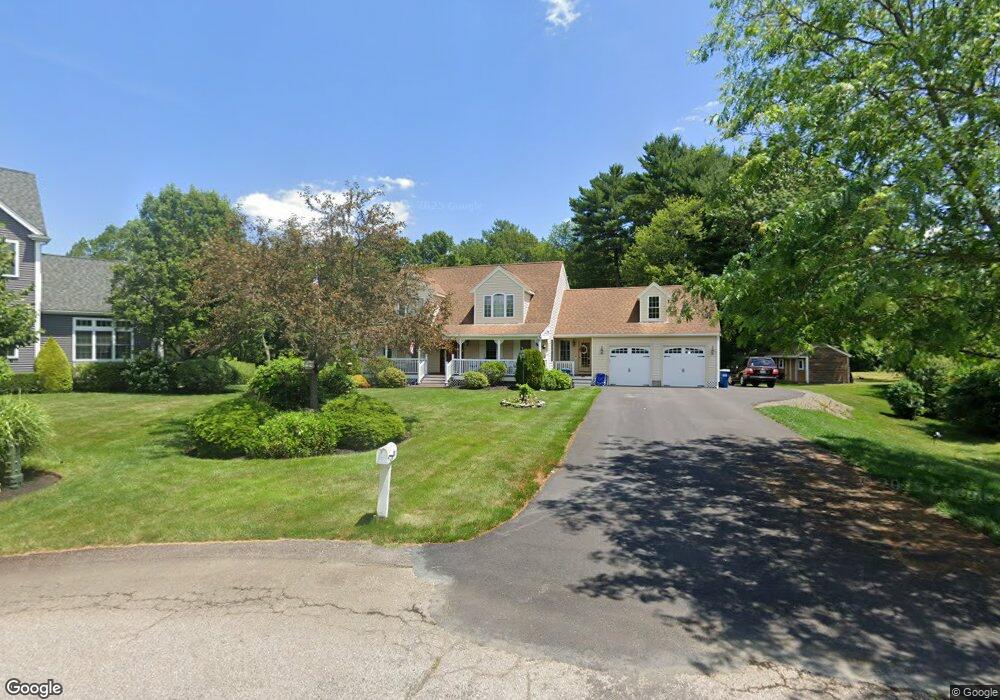
21 Sandy Pond Cir East Bridgewater, MA 02333
Estimated Value: $782,000 - $909,000
3
Beds
4
Baths
2,709
Sq Ft
$313/Sq Ft
Est. Value
About This Home
This home is located at 21 Sandy Pond Cir, East Bridgewater, MA 02333 and is currently estimated at $847,805, approximately $312 per square foot. 21 Sandy Pond Cir is a home located in Plymouth County with nearby schools including Central Elementary School, Gordon W Mitchell Middle School, and East Bridgewater Jr./Sr. High School.
Ownership History
Date
Name
Owned For
Owner Type
Purchase Details
Closed on
Oct 3, 2012
Sold by
Wilcox Mark E and Wilcox Erin M
Bought by
Wilcox Erin M
Current Estimated Value
Purchase Details
Closed on
Apr 12, 2005
Sold by
Brown Bldrs Inc
Bought by
Wilcox Mark E and Wilcox Erin M
Home Financials for this Owner
Home Financials are based on the most recent Mortgage that was taken out on this home.
Original Mortgage
$400,000
Interest Rate
5.7%
Mortgage Type
Purchase Money Mortgage
Create a Home Valuation Report for This Property
The Home Valuation Report is an in-depth analysis detailing your home's value as well as a comparison with similar homes in the area
Home Values in the Area
Average Home Value in this Area
Purchase History
| Date | Buyer | Sale Price | Title Company |
|---|---|---|---|
| Wilcox Erin M | -- | -- | |
| Wilcox Mark E | $510,767 | -- |
Source: Public Records
Mortgage History
| Date | Status | Borrower | Loan Amount |
|---|---|---|---|
| Previous Owner | Wilcox Mark E | $360,000 | |
| Previous Owner | Wilcox Mark E | $400,000 |
Source: Public Records
Tax History Compared to Growth
Tax History
| Year | Tax Paid | Tax Assessment Tax Assessment Total Assessment is a certain percentage of the fair market value that is determined by local assessors to be the total taxable value of land and additions on the property. | Land | Improvement |
|---|---|---|---|---|
| 2025 | $10,073 | $736,900 | $211,900 | $525,000 |
| 2024 | $9,897 | $715,100 | $203,700 | $511,400 |
| 2023 | $9,631 | $666,500 | $203,400 | $463,100 |
| 2022 | $8,978 | $575,500 | $169,700 | $405,800 |
| 2021 | $8,772 | $514,500 | $163,100 | $351,400 |
| 2020 | $8,545 | $494,200 | $157,400 | $336,800 |
| 2019 | $4,952 | $475,200 | $150,400 | $324,800 |
| 2018 | $4,736 | $455,100 | $150,400 | $304,700 |
| 2017 | $4,500 | $437,300 | $143,500 | $293,800 |
| 2016 | $7,725 | $425,400 | $143,500 | $281,900 |
| 2015 | $7,468 | $420,500 | $142,500 | $278,000 |
| 2014 | $7,217 | $415,500 | $139,500 | $276,000 |
Source: Public Records
Map
Nearby Homes
- 25 Dominique Dr
- 2 Edgewood Cir
- 29 Hayes Rd
- 24 High Pond Dr
- 73 Trailwood Dr
- 22 Hudson St
- 2045 Washington St
- 67 Country Dr
- 94 Pond St
- 49 Country Dr
- 53 Elm St
- 1993 Washington St
- 71 Stonegate Dr
- 74 Magnolia Way
- 51 Stonegate Dr
- 211 Elm St
- 114 Plain St
- 34 Highland Cir
- 100 Eliab Latham Way
- 1141 Plymouth St