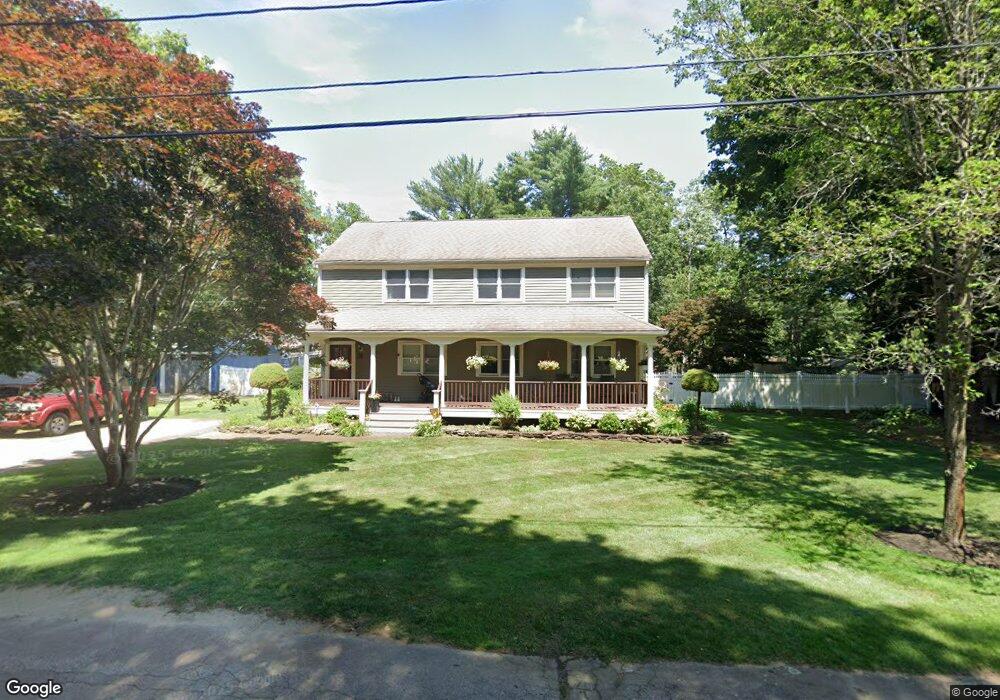
21 Shaw St Carver, MA 02330
Estimated Value: $547,000 - $655,000
3
Beds
3
Baths
2,080
Sq Ft
$299/Sq Ft
Est. Value
About This Home
This home is located at 21 Shaw St, Carver, MA 02330 and is currently estimated at $622,246, approximately $299 per square foot. 21 Shaw St is a home located in Plymouth County with nearby schools including Carver Elementary School, Carver Middle/High School, and Samuel Fuller School.
Ownership History
Date
Name
Owned For
Owner Type
Purchase Details
Closed on
May 9, 2001
Sold by
Williams Joanne M
Bought by
Henderson Matthew
Current Estimated Value
Create a Home Valuation Report for This Property
The Home Valuation Report is an in-depth analysis detailing your home's value as well as a comparison with similar homes in the area
Home Values in the Area
Average Home Value in this Area
Purchase History
| Date | Buyer | Sale Price | Title Company |
|---|---|---|---|
| Henderson Matthew | $163,000 | -- |
Source: Public Records
Mortgage History
| Date | Status | Borrower | Loan Amount |
|---|---|---|---|
| Open | Henderson Matthew | $200,000 | |
| Closed | Henderson Matthew | $125,000 | |
| Closed | Henderson Matthew | $190,000 |
Source: Public Records
Tax History Compared to Growth
Tax History
| Year | Tax Paid | Tax Assessment Tax Assessment Total Assessment is a certain percentage of the fair market value that is determined by local assessors to be the total taxable value of land and additions on the property. | Land | Improvement |
|---|---|---|---|---|
| 2025 | $7,427 | $535,500 | $130,700 | $404,800 |
| 2024 | $6,851 | $483,500 | $128,200 | $355,300 |
| 2023 | $6,638 | $455,000 | $128,200 | $326,800 |
| 2022 | $6,279 | $392,900 | $109,600 | $283,300 |
| 2021 | $6,048 | $357,000 | $97,800 | $259,200 |
| 2020 | $5,767 | $335,500 | $91,400 | $244,100 |
| 2019 | $5,618 | $329,500 | $88,800 | $240,700 |
| 2018 | $5,400 | $306,300 | $88,800 | $217,500 |
| 2017 | $5,213 | $294,700 | $85,400 | $209,300 |
| 2016 | $4,801 | $281,900 | $81,300 | $200,600 |
| 2015 | $4,696 | $276,100 | $81,300 | $194,800 |
| 2014 | $4,518 | $265,600 | $102,800 | $162,800 |
Source: Public Records
Map
Nearby Homes
- 35 Silva St
- 7 Green St
- 26 Santana Way Unit 26
- 11 Brockton Ave
- 38 Cedar Dr
- 32 Doreen Way
- 70 Wall St
- 135 Plymouth St
- 269 Purchase St
- Lot1 Elk Run Dr
- 81 Center St
- 235 Main St
- 6 Susan Cir
- 13 Pond View Way
- 122 High St
- 56 Bunnys Rd
- 146 S Meadow Rd
- 48 S Meadow Village
- 22 S Meadow Village
- 29 S Meadow Village