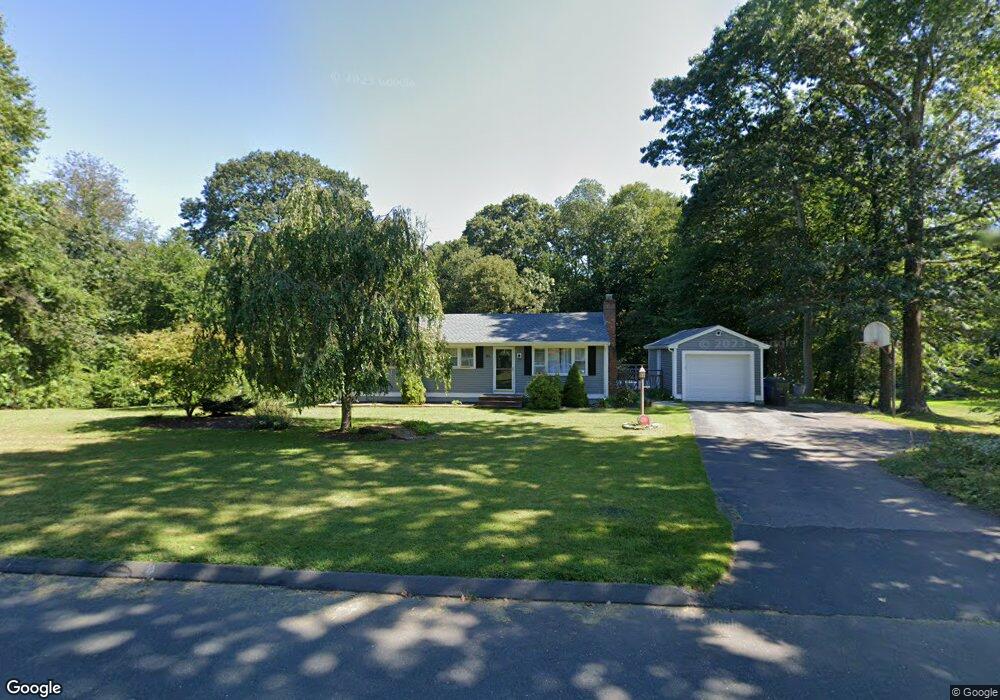
21 Sherry Cir Tolland, CT 06084
Estimated Value: $294,000 - $335,000
3
Beds
2
Baths
1,008
Sq Ft
$318/Sq Ft
Est. Value
About This Home
This home is located at 21 Sherry Cir, Tolland, CT 06084 and is currently estimated at $320,091, approximately $317 per square foot. 21 Sherry Cir is a home located in Tolland County with nearby schools including Birch Grove Primary School, Tolland Intermediate School, and Tolland Middle School.
Ownership History
Date
Name
Owned For
Owner Type
Purchase Details
Closed on
May 22, 2006
Sold by
Hurlburt Gregory C and Hurlburt Deborah
Bought by
Babcock Robert J and Babcock Megan E
Current Estimated Value
Home Financials for this Owner
Home Financials are based on the most recent Mortgage that was taken out on this home.
Original Mortgage
$222,950
Outstanding Balance
$129,271
Interest Rate
6.42%
Estimated Equity
$190,820
Purchase Details
Closed on
Jun 28, 2001
Sold by
Prue Kimberli
Bought by
Hurlburt Gregory and Hurlburt Deborah
Home Financials for this Owner
Home Financials are based on the most recent Mortgage that was taken out on this home.
Original Mortgage
$147,682
Interest Rate
7.14%
Purchase Details
Closed on
Feb 28, 2000
Sold by
Webb Edward and Webb Theresa
Bought by
Prue Kymberli
Purchase Details
Closed on
Feb 22, 1993
Sold by
Payton Nolan and Payton Maribeth
Bought by
Webb Edward and Webb Therese
Create a Home Valuation Report for This Property
The Home Valuation Report is an in-depth analysis detailing your home's value as well as a comparison with similar homes in the area
Home Values in the Area
Average Home Value in this Area
Purchase History
| Date | Buyer | Sale Price | Title Company |
|---|---|---|---|
| Babcock Robert J | $224,900 | -- | |
| Babcock Robert J | $224,900 | -- | |
| Hurlburt Gregory | $145,000 | -- | |
| Hurlburt Gregory | $145,000 | -- | |
| Prue Kymberli | $124,000 | -- | |
| Prue Kymberli | $124,000 | -- | |
| Webb Edward | $107,000 | -- | |
| Webb Edward | $107,000 | -- |
Source: Public Records
Mortgage History
| Date | Status | Borrower | Loan Amount |
|---|---|---|---|
| Open | Webb Edward | $222,950 | |
| Closed | Webb Edward | $222,950 | |
| Previous Owner | Webb Edward | $147,682 |
Source: Public Records
Tax History Compared to Growth
Tax History
| Year | Tax Paid | Tax Assessment Tax Assessment Total Assessment is a certain percentage of the fair market value that is determined by local assessors to be the total taxable value of land and additions on the property. | Land | Improvement |
|---|---|---|---|---|
| 2025 | $4,970 | $182,800 | $60,600 | $122,200 |
| 2024 | $4,672 | $123,700 | $57,700 | $66,000 |
| 2023 | $4,618 | $123,700 | $57,700 | $66,000 |
| 2022 | $4,466 | $122,100 | $57,700 | $64,400 |
| 2021 | $4,531 | $122,100 | $57,700 | $64,400 |
| 2020 | $4,402 | $122,100 | $57,700 | $64,400 |
| 2019 | $3,940 | $109,300 | $59,500 | $49,800 |
| 2018 | $3,826 | $109,300 | $59,500 | $49,800 |
| 2017 | $3,737 | $109,300 | $59,500 | $49,800 |
| 2016 | $3,737 | $109,300 | $59,500 | $49,800 |
| 2015 | $3,646 | $109,300 | $59,500 | $49,800 |
| 2014 | $3,704 | $119,300 | $66,200 | $53,100 |
Source: Public Records
Map
Nearby Homes
- 88 Anthony Rd
- 10 Summit Dr
- 454 Merrow Rd
- 527 Merrow Rd
- 312 Merrow Rd
- 284 Merrow Rd
- 248 Merrow Rd
- 12 Stone Pond Rd
- 18 Stone Pond Rd
- 10 Depot Rd Unit 25
- 226 Goose Ln
- 97 Cassidy Hill Rd
- 6 Timber Ln
- 257 Torry Rd
- 4 Elgin Dr
- 190 Cider Mill Rd
- 38 Homestead Dr
- 0 Tolland Turnpike Unit 24107059
- 0 Tolland Stage Rd Unit 24101836
- 300 Geraldine Dr