21 Sleepy Hollow Ln East Stroudsburg, PA 18302
Estimated Value: $290,000 - $364,000
3
Beds
3
Baths
2,212
Sq Ft
$152/Sq Ft
Est. Value
About This Home
This home is located at 21 Sleepy Hollow Ln, East Stroudsburg, PA 18302 and is currently estimated at $336,911, approximately $152 per square foot. 21 Sleepy Hollow Ln is a home located in Monroe County with nearby schools including Middle Smithfield Elementary School, Lehman Intermediate School, and Tcelc.
Ownership History
Date
Name
Owned For
Owner Type
Purchase Details
Closed on
Sep 18, 2018
Sold by
Killeen Francis Patrick and Killeen John Jennifer
Bought by
John Jennifer C
Current Estimated Value
Home Financials for this Owner
Home Financials are based on the most recent Mortgage that was taken out on this home.
Original Mortgage
$131,325
Outstanding Balance
$114,287
Interest Rate
4.5%
Mortgage Type
New Conventional
Estimated Equity
$222,624
Purchase Details
Closed on
Jul 21, 2011
Sold by
Hsbc Bank Usa National Association
Bought by
Killeen Francis Patrick and Killeen Jenny C
Home Financials for this Owner
Home Financials are based on the most recent Mortgage that was taken out on this home.
Original Mortgage
$132,795
Interest Rate
4.25%
Mortgage Type
VA
Purchase Details
Closed on
Feb 19, 2009
Sold by
Chimielewski Matthew and Chimielewski Zenona
Bought by
Hsbc Bank Usa National Association
Create a Home Valuation Report for This Property
The Home Valuation Report is an in-depth analysis detailing your home's value as well as a comparison with similar homes in the area
Home Values in the Area
Average Home Value in this Area
Purchase History
| Date | Buyer | Sale Price | Title Company |
|---|---|---|---|
| John Jennifer C | -- | Amrock Inc | |
| Killeen Francis Patrick | $130,000 | None Available | |
| Hsbc Bank Usa National Association | $2,899 | None Available |
Source: Public Records
Mortgage History
| Date | Status | Borrower | Loan Amount |
|---|---|---|---|
| Open | John Jennifer C | $131,325 | |
| Previous Owner | Killeen Francis Patrick | $132,795 |
Source: Public Records
Tax History Compared to Growth
Tax History
| Year | Tax Paid | Tax Assessment Tax Assessment Total Assessment is a certain percentage of the fair market value that is determined by local assessors to be the total taxable value of land and additions on the property. | Land | Improvement |
|---|---|---|---|---|
| 2025 | $1,130 | $138,650 | $25,110 | $113,540 |
| 2024 | $945 | $138,650 | $25,110 | $113,540 |
| 2023 | $4,983 | $138,650 | $25,110 | $113,540 |
| 2022 | $5,049 | $138,650 | $25,110 | $113,540 |
| 2021 | $4,973 | $138,650 | $25,110 | $113,540 |
| 2020 | $4,606 | $138,650 | $25,110 | $113,540 |
| 2019 | $5,125 | $24,440 | $4,000 | $20,440 |
| 2018 | $5,125 | $24,440 | $4,000 | $20,440 |
| 2017 | $5,125 | $24,440 | $4,000 | $20,440 |
| 2016 | $4,699 | $24,440 | $4,000 | $20,440 |
| 2015 | -- | $24,440 | $4,000 | $20,440 |
| 2014 | -- | $24,440 | $4,000 | $20,440 |
Source: Public Records
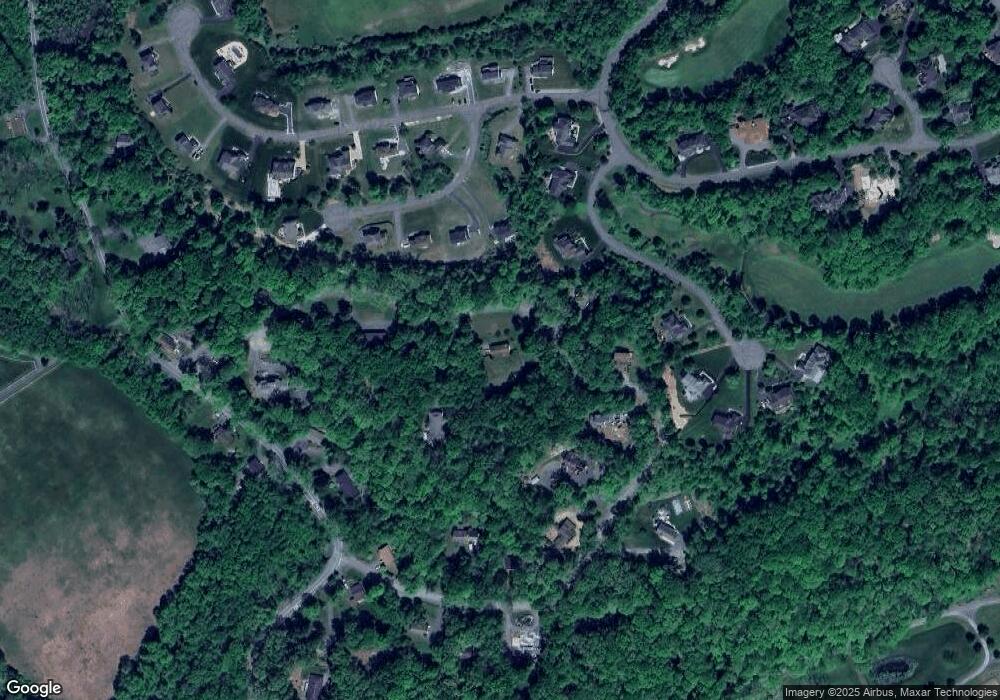
Map
Nearby Homes
- 23 Sleepy Hollow Ln
- 0 Benson Ct Unit PM-135203
- 19 Swan Ct
- 19L Swan Ct
- 24 Swan Ct
- 259 Great Bear Way Rd
- 74 Great Bear Way Rd 74 Rd
- 145 Rising Meadow Way
- 165 Rising Meadow Way
- 353 Great Bear Way Rd
- 361 Great Bear Way Rd
- 282 Crabapple Ln
- 118 Chris Ali State Place
- 86 Lower Lakeview Dr
- 229 Rising Meadow Way
- 151 Northslope II Rd
- 301 Northslope II Rd
- 324 Hollow Rd Unit 325
- 255 Rising Meadow Way
- 144 Frutchey Dr
- 21 Sleepy Hollow Estates
- Lot 107 Sleepy Hollow Ln
- 22 Sleepy Hollow Ln
- 22 Sleepy Hollow Ln
- 23 Sleepy Hollow Ln
- 123 Tall Timber Cir
- 25 Sleepy Hollow Ln
- 17 Sleepy Hollow Ln
- 217 Legacy Way
- 11 Sleepy Hollow
- 11 Sleepy Hollow Estates
- 11 Sleepy Hollow Ln
- 207 Legacy Way
- 211 Legacy Way
- 504 Tall Timber Cir
- 124 Tall Timber Cir
- 122 Tall Timber Cir
- 21 Legacy Way
- 145 Hollow Rd
- 17 Legacy Way