21 Smithfield Ct Unit 9 Basking Ridge, NJ 07920
Estimated Value: $414,821 - $445,000
Studio
--
Bath
1,050
Sq Ft
$411/Sq Ft
Est. Value
About This Home
This home is located at 21 Smithfield Ct Unit 9, Basking Ridge, NJ 07920 and is currently estimated at $431,205, approximately $410 per square foot. 21 Smithfield Ct Unit 9 is a home located in Somerset County with nearby schools including Cedar Hill Elementary School, Liberty Corner Elementary School, and William Annin Middle School.
Ownership History
Date
Name
Owned For
Owner Type
Purchase Details
Closed on
Jun 27, 2008
Sold by
Thuring Janice Cramer
Bought by
Newman Kenneth and Newman Barbara
Current Estimated Value
Purchase Details
Closed on
Apr 11, 2003
Sold by
Sun Yuan
Bought by
Thuring Joseph and Thuring Janice
Home Financials for this Owner
Home Financials are based on the most recent Mortgage that was taken out on this home.
Original Mortgage
$155,000
Interest Rate
5.84%
Purchase Details
Closed on
May 30, 2002
Sold by
Incandela John
Bought by
Sun Yuanyuan and Lu Dennis
Home Financials for this Owner
Home Financials are based on the most recent Mortgage that was taken out on this home.
Original Mortgage
$170,000
Interest Rate
7%
Purchase Details
Closed on
Nov 10, 2000
Sold by
Flagg Joan
Bought by
Incandela John
Home Financials for this Owner
Home Financials are based on the most recent Mortgage that was taken out on this home.
Original Mortgage
$160,000
Interest Rate
7.81%
Create a Home Valuation Report for This Property
The Home Valuation Report is an in-depth analysis detailing your home's value as well as a comparison with similar homes in the area
Home Values in the Area
Average Home Value in this Area
Purchase History
| Date | Buyer | Sale Price | Title Company |
|---|---|---|---|
| Newman Kenneth | $286,000 | Chicago Title Insurance Co | |
| Thuring Joseph | $244,000 | -- | |
| Sun Yuanyuan | $230,000 | -- | |
| Incandela John | $191,000 | -- |
Source: Public Records
Mortgage History
| Date | Status | Borrower | Loan Amount |
|---|---|---|---|
| Previous Owner | Thuring Joseph | $155,000 | |
| Previous Owner | Sun Yuanyuan | $170,000 | |
| Previous Owner | Incandela John | $160,000 |
Source: Public Records
Tax History
| Year | Tax Paid | Tax Assessment Tax Assessment Total Assessment is a certain percentage of the fair market value that is determined by local assessors to be the total taxable value of land and additions on the property. | Land | Improvement |
|---|---|---|---|---|
| 2025 | $5,917 | $379,400 | $140,000 | $239,400 |
| 2024 | $5,917 | $332,600 | $124,000 | $208,600 |
Source: Public Records
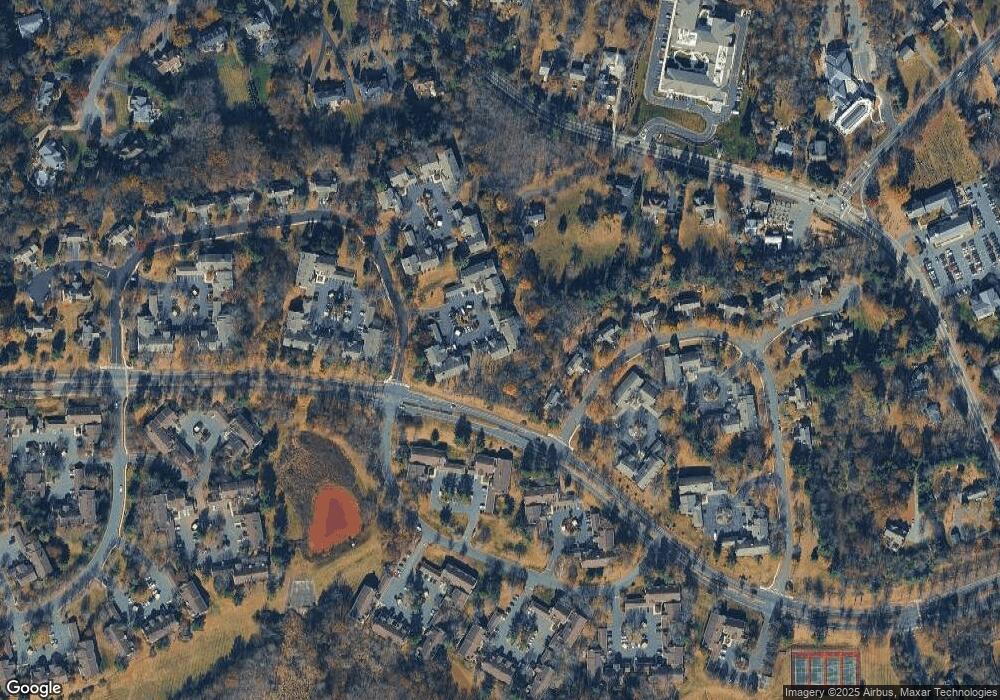
Map
Nearby Homes
- 62 Smithfield Ct
- 46 Smithfield Ct
- 171 Jamestown Rd Ondo Unit 171
- 58 Smithfield Ct Unit 10
- 272 Potomac Dr
- 206 Potomac Dr
- 22 Alexandria Way
- 168 Potomac Dr Condo Unit 168
- 192 Potomac Dr Condo Unit 192
- 20 Alexandria Way
- 78 Potomac Dr Ondo
- 49 Alexandria Way Ondo
- 7 Potomac Dr Unit 7
- 195 Alexandria Way
- 9 Cooper Ln
- 3702 Balsam Way
- 1 Joss Way
- 85 Sycamore Ct Ondo
- 40 Chestnut Ct
- 112 Midvale Ave
- 24 Smithfield Ct
- 22 Smithfield Ct
- 23 Smithfield Ct
- 19 Smithfield Ct
- 17 Smithfield Ct Unit 5
- 20 Smithfield Ct
- 15 Smithfield Ct
- 18 Smithfield Ct
- 16 Smithfield Ct Unit 4
- 13 Smithfield Ct
- 2 Smithfield Ct
- 1 Smithfield Ct
- 4 Smithfield Ct
- 3 Smithfield Ct
- 6 Smithfield Ct
- 5 Smithfield Ct
- 35 Smithfield Ct
- 9 Smithfield Ct
- 36 Smithfield Ct
- 8 Smithfield Ct
Your Personal Tour Guide
Ask me questions while you tour the home.