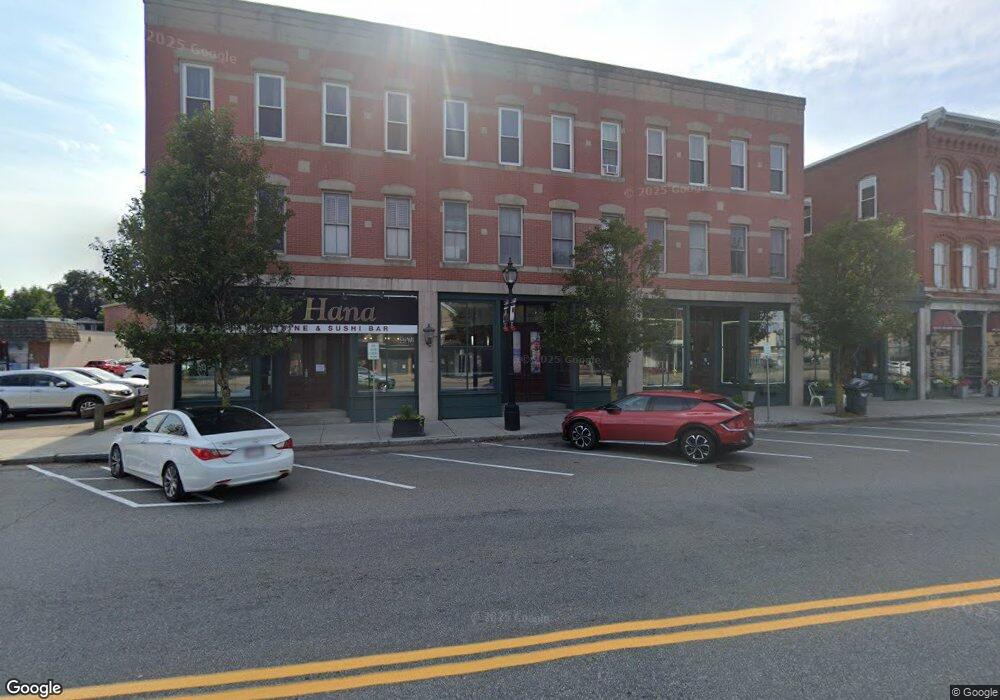
21 South St Westborough, MA 01581
Estimated Value: $253,000 - $334,376
1
Bed
1
Bath
6,217
Sq Ft
$46/Sq Ft
Est. Value
About This Home
This home is located at 21 South St, Westborough, MA 01581 and is currently estimated at $284,094, approximately $45 per square foot. 21 South St is a home located in Worcester County with nearby schools including Westborough High School, Ebridge Montessori School, and Westboro Knowledge Beginnings.
Ownership History
Date
Name
Owned For
Owner Type
Purchase Details
Closed on
Dec 13, 2024
Sold by
Mangalarapu Tirupathi
Bought by
Casey Chris
Current Estimated Value
Home Financials for this Owner
Home Financials are based on the most recent Mortgage that was taken out on this home.
Original Mortgage
$212,000
Outstanding Balance
$209,923
Interest Rate
6.72%
Mortgage Type
Purchase Money Mortgage
Estimated Equity
$74,171
Purchase Details
Closed on
May 2, 2017
Sold by
Sullivan Mark E and Sullivan Margaret
Bought by
Mangalarapu Tirupathi
Home Financials for this Owner
Home Financials are based on the most recent Mortgage that was taken out on this home.
Original Mortgage
$149,150
Interest Rate
3.5%
Mortgage Type
New Conventional
Purchase Details
Closed on
Nov 1, 2004
Sold by
Ebr 90 Rt and Forrestall
Bought by
Paradise Robert J
Home Financials for this Owner
Home Financials are based on the most recent Mortgage that was taken out on this home.
Original Mortgage
$118,600
Interest Rate
5.74%
Mortgage Type
Purchase Money Mortgage
Purchase Details
Closed on
Oct 21, 2004
Sold by
Ebr 90 Rt and Forrestall
Bought by
Sullivan Mark E
Home Financials for this Owner
Home Financials are based on the most recent Mortgage that was taken out on this home.
Original Mortgage
$118,600
Interest Rate
5.74%
Mortgage Type
Purchase Money Mortgage
Purchase Details
Closed on
Aug 24, 2004
Sold by
Ebr 90 Rt and Forrestall
Bought by
Lopez Alvaro B
Purchase Details
Closed on
Aug 11, 2004
Sold by
Ebr 90 Rt and Forrestall
Bought by
Bernat James T and Bernat James T
Create a Home Valuation Report for This Property
The Home Valuation Report is an in-depth analysis detailing your home's value as well as a comparison with similar homes in the area
Home Values in the Area
Average Home Value in this Area
Purchase History
| Date | Buyer | Sale Price | Title Company |
|---|---|---|---|
| Casey Chris | $265,000 | None Available | |
| Casey Chris | $265,000 | None Available | |
| Mangalarapu Tirupathi | $157,000 | -- | |
| Paradise Robert J | $144,900 | -- | |
| Paradise Robert J | $144,900 | -- | |
| Leblanc Bradley S | $124,900 | -- | |
| Paradise Robert J | $144,900 | -- | |
| Sullivan Mark E | $144,900 | -- | |
| Sullivan Mark E | $144,900 | -- | |
| Lopez Alvaro B | $119,900 | -- | |
| Lopez Alvaro B | $119,900 | -- | |
| Bernat James T | $141,900 | -- | |
| Oconnor Ryan J | $139,900 | -- | |
| Bernat James T | $141,900 | -- |
Source: Public Records
Mortgage History
| Date | Status | Borrower | Loan Amount |
|---|---|---|---|
| Open | Casey Chris | $212,000 | |
| Closed | Casey Chris | $212,000 | |
| Previous Owner | Mangalarapu Tirupathi | $149,150 | |
| Previous Owner | Paradise Robert J | $118,600 | |
| Previous Owner | Leblanc Bradley S | $137,655 |
Source: Public Records
Tax History Compared to Growth
Tax History
| Year | Tax Paid | Tax Assessment Tax Assessment Total Assessment is a certain percentage of the fair market value that is determined by local assessors to be the total taxable value of land and additions on the property. | Land | Improvement |
|---|---|---|---|---|
| 2025 | $4,144 | $254,400 | $0 | $254,400 |
| 2024 | $5,164 | $314,700 | $0 | $314,700 |
| 2023 | $3,115 | $185,000 | $0 | $185,000 |
| 2022 | $3,308 | $178,900 | $0 | $178,900 |
| 2021 | $2,963 | $159,800 | $0 | $159,800 |
| 2020 | $2,993 | $163,400 | $0 | $163,400 |
| 2019 | $2,874 | $156,800 | $0 | $156,800 |
| 2018 | $2,778 | $150,500 | $0 | $150,500 |
| 2017 | $2,433 | $136,700 | $0 | $136,700 |
| 2016 | $2,465 | $138,700 | $0 | $138,700 |
| 2015 | $2,467 | $132,700 | $0 | $132,700 |
Source: Public Records
Map
Nearby Homes
- 21 South St Unit 31
- 14 Grove St Unit 2
- 75 South St
- 15 Beach St
- 43 Church St
- 48 High Street Extension
- 23 Water St
- 4403 Peters Farm Way Unit 403
- 7 Mayberry Dr Unit H
- 56 Ruggles St
- 14 Mayberry Dr Unit 10
- 6 Folly Ln
- 7 Jennings Rd
- 19 Fisher St
- 4 Upton Rd
- 9 Treetop Park
- 19 Treetop Park Unit 19
- 22 Treetop Park
- 3 Dover Way
- 52 Treetop Park Unit 52
- 21 South St Unit 3
- 21 South St Unit 2
- 21 South St Unit 39
- 21 South St Unit 38
- 21 South St Unit 37
- 21 South St Unit 36
- 21 South St Unit 33
- 21 South St Unit 32
- 21 South St Unit 30
- 21 South St Unit 29
- 21 South St Unit 28
- 21 South St Unit 27
- 21 South St Unit 26
- 21 South St Unit 25
- 21 South St Unit 24
- 21 South St Unit 23
- 21 South St Unit 22
- 21 South St Unit 20
- 21 South St Unit 6
- 6 W Main St