
Seller's Agent in 2025
Danielle Fiorina
Century 21 Crest Real Estate
(973) 460-4352
6 in this area
80 Total Sales
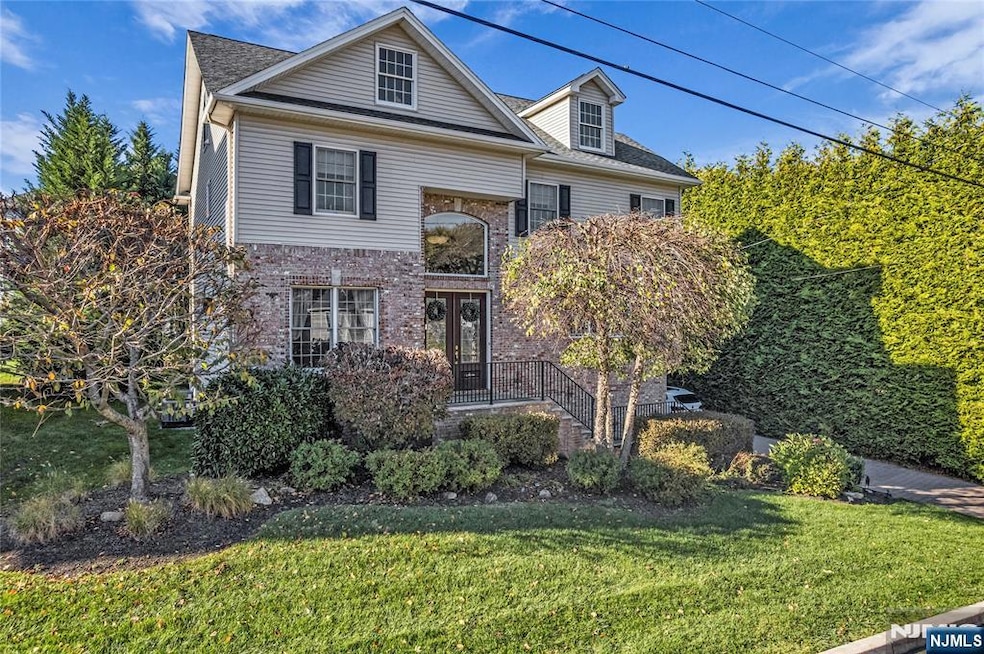
Exquisite custom built 4 bedroom 3.5 bath colonial with third level bonus room, not to be missed. Impeccably maintained inside and out. All public utilities. Tremendous basement, 2 car garage, 2 units for multi-zone heating and cooling. Irrigation system, central vac, Anderson windows. Gorgeous millwork throughout, solid wood doors, crown moldings, wood floors, 10' ceiling on 1st level, recessed lighting. Striking staircase leading to 2nd and 3rd level with wrought iron spindles. Double door entrance to 2 story foyer with beautiful picture window. First level is complete with formal living, formal dining room, family room, powder room and eat-in kitchen. Eat-in kitchen with separate dining area, center island, Bosch stainless steel appliances, tile flooring and tile backsplash, sliders to Trex deck leading to private backyard with mature plantings. Elevated family room with gas fireplace and an abundance of windows. Second level features spacious primary suite with walk-in closet, additional double closet, sitting area and primary bath. Primary bath with jetted tub, shower stall, dual vanity with dressing table. Ensuite bedroom with full bath and double closet. Two additional bedrooms with adjoining full bath with dual vanity and tub shower. Lush backyard. Paver driveway. Minutes to major highways, NJ Transit, shopping, restaurants, parks and schools.
Last Buyer's Agent
Prominent Properties Sotheby's International Realty-Saddle River
| Date | Type | Sale Price | Title Company |
|---|---|---|---|
| Deed | $850,000 | Stewart Title Guaranty Company | |
| Deed | $540,000 | First American Title Ins Co | |
| Deed | $450,000 | None Available |
| Date | Status | Loan Amount | Loan Type |
|---|---|---|---|
| Previous Owner | $417,000 | Stand Alone First |
| Date | Event | Price | List to Sale | Price per Sq Ft |
|---|---|---|---|---|
| 12/19/2025 12/19/25 | Sold | $850,000 | -1.2% | $285 / Sq Ft |
| 11/03/2025 11/03/25 | Pending | -- | -- | -- |
| 10/23/2025 10/23/25 | For Sale | $859,900 | -- | $288 / Sq Ft |
| Year | Tax Paid | Tax Assessment Tax Assessment Total Assessment is a certain percentage of the fair market value that is determined by local assessors to be the total taxable value of land and additions on the property. | Land | Improvement |
|---|---|---|---|---|
| 2025 | $14,980 | $662,700 | $241,000 | $421,700 |
| 2024 | $15,223 | $599,900 | $206,000 | $393,900 |
| 2023 | $15,223 | $573,600 | $183,500 | $390,100 |
| 2022 | $14,308 | $539,800 | $176,000 | $363,800 |
| 2021 | $14,308 | $373,200 | $134,700 | $238,500 |
| 2020 | $13,943 | $373,200 | $134,700 | $238,500 |
| 2019 | $13,637 | $373,200 | $134,700 | $238,500 |
| 2018 | $13,461 | $373,200 | $134,700 | $238,500 |
| 2017 | $13,118 | $373,200 | $134,700 | $238,500 |
| 2016 | $12,778 | $373,200 | $134,700 | $238,500 |
| 2015 | $12,573 | $373,200 | $134,700 | $238,500 |
| 2014 | $12,185 | $373,200 | $134,700 | $238,500 |
Seller's Agent in 2025
Danielle Fiorina
Century 21 Crest Real Estate
(973) 460-4352
6 in this area
80 Total Sales
Buyer's Agent in 2025
Russell & Evan Team
Prominent Properties Sotheby's International Realty-Saddle River
(213) 590-2588
1 in this area
59 Total Sales
Source: New Jersey MLS
MLS Number: 25037885
APN: 03-00047-0000-00013-01
Disclaimer: Certain information contained herein is derived from information provided by parties other than Homes.com. All information provided is deemed reliable, but is not guaranteed to be accurate and should be independently verified.
![]() The data relating to the real estate for sale on this web site comes in part from the Internet Data Exchange Program of the NJMLS. Real estate listings held by brokerage firms other than Ten-X are marked with the Internet Data Exchange logo and information about them includes the name of the listing brokers. Some properties listed with the participating brokers do not appear on this website at the request of the seller. Listings of brokers that do not participate in Internet Data Exchange do not appear on this website.
The data relating to the real estate for sale on this web site comes in part from the Internet Data Exchange Program of the NJMLS. Real estate listings held by brokerage firms other than Ten-X are marked with the Internet Data Exchange logo and information about them includes the name of the listing brokers. Some properties listed with the participating brokers do not appear on this website at the request of the seller. Listings of brokers that do not participate in Internet Data Exchange do not appear on this website.
All information deemed reliable but not guaranteed. Source: New Jersey Multiple Listing, Inc.
© 2026 New Jersey Multiple Listing Service Inc. All rights reserved.
Ask me questions while you tour the home.