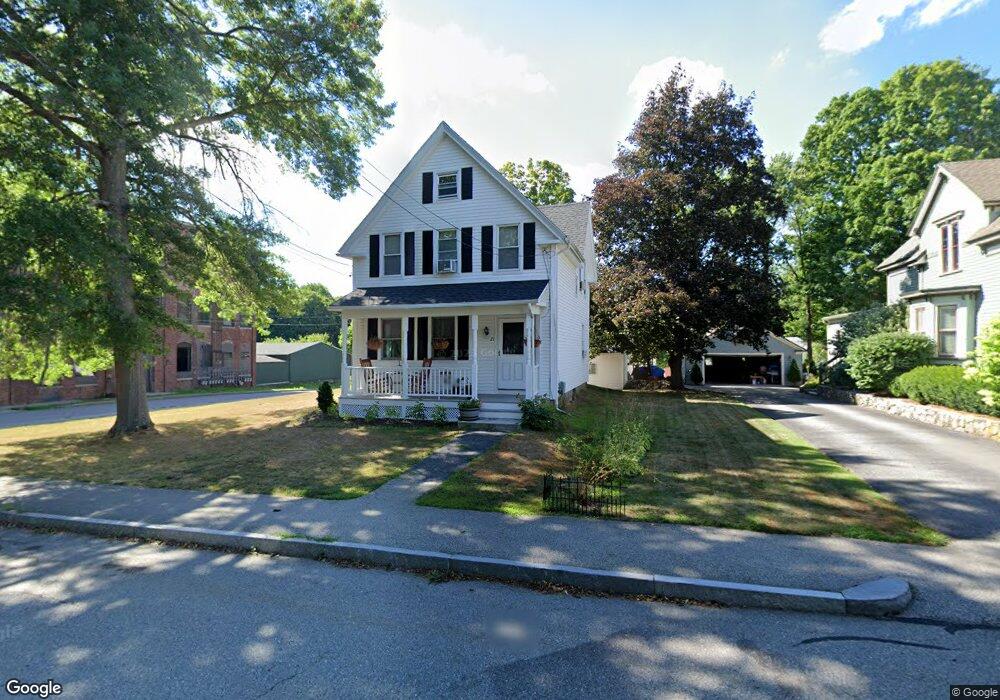
21 Spring St Westborough, MA 01581
Estimated Value: $636,000 - $726,000
3
Beds
2
Baths
1,796
Sq Ft
$374/Sq Ft
Est. Value
About This Home
This home is located at 21 Spring St, Westborough, MA 01581 and is currently estimated at $671,009, approximately $373 per square foot. 21 Spring St is a home located in Worcester County with nearby schools including Westborough High School, Ebridge Montessori School, and Westboro Knowledge Beginnings.
Ownership History
Date
Name
Owned For
Owner Type
Purchase Details
Closed on
Mar 27, 1987
Sold by
Leland Roger B
Bought by
Santella Richard M
Current Estimated Value
Home Financials for this Owner
Home Financials are based on the most recent Mortgage that was taken out on this home.
Original Mortgage
$15,000
Interest Rate
9.11%
Create a Home Valuation Report for This Property
The Home Valuation Report is an in-depth analysis detailing your home's value as well as a comparison with similar homes in the area
Home Values in the Area
Average Home Value in this Area
Purchase History
| Date | Buyer | Sale Price | Title Company |
|---|---|---|---|
| Santella Richard M | $115,000 | -- |
Source: Public Records
Mortgage History
| Date | Status | Borrower | Loan Amount |
|---|---|---|---|
| Closed | Santella Richard M | $15,000 | |
| Closed | Santella Richard M | $85,000 |
Source: Public Records
Tax History Compared to Growth
Tax History
| Year | Tax Paid | Tax Assessment Tax Assessment Total Assessment is a certain percentage of the fair market value that is determined by local assessors to be the total taxable value of land and additions on the property. | Land | Improvement |
|---|---|---|---|---|
| 2025 | $9,233 | $566,800 | $299,800 | $267,000 |
| 2024 | $8,576 | $522,600 | $278,700 | $243,900 |
| 2023 | $8,250 | $489,900 | $260,700 | $229,200 |
| 2022 | $7,620 | $412,100 | $209,300 | $202,800 |
| 2021 | $7,249 | $391,000 | $207,000 | $184,000 |
| 2020 | $6,952 | $379,500 | $195,500 | $184,000 |
| 2019 | $6,712 | $366,200 | $187,800 | $178,400 |
| 2018 | $5,955 | $322,600 | $172,500 | $150,100 |
| 2017 | $5,424 | $304,700 | $172,500 | $132,200 |
| 2016 | $5,530 | $311,200 | $172,500 | $138,700 |
| 2015 | $5,655 | $304,200 | $172,500 | $131,700 |
Source: Public Records
Map
Nearby Homes
- 14 Grove St Unit 2
- 14 Grove St Unit 3
- 43 Church St
- 18 Church St
- 7 Mayberry Dr Unit H
- 9 Mayberry Dr Unit 1
- 8 West St
- 8 Mayberry Dr Unit 5
- 44 South St
- 14C Mayberry Dr Unit 1
- 6 Folly Ln
- 19 Fisher St
- 75 South St
- 15 Beach St
- 19 Treetop Park Unit 19
- 9 Treetop Park
- 21 Sheffield Way
- 7 Jennings Rd
- 52 Treetop Park Unit 52
- 22 Harvey Ln
- 19 Spring St
- 3 Orchard St
- 17 Spring St
- 17 Spring St Unit 2
- 69 Milk St Unit 110/112
- 69 Milk St Unit 118
- 69 Milk St Unit 310
- 69 Milk St Unit 101
- 69 Milk St Unit 108
- 69 Milk St Unit 224
- 69 Milk St Unit 308
- 69 Milk St Unit 205
- 69 Milk St Unit 100
- 69 Milk St Unit 300
- 69 Milk St Unit 120
- 69 Milk St Unit 116
- 69 Milk St Unit 304
- 69 Milk St Unit 217
- 69 Milk St Unit 200
- 69 Milk St Unit 218