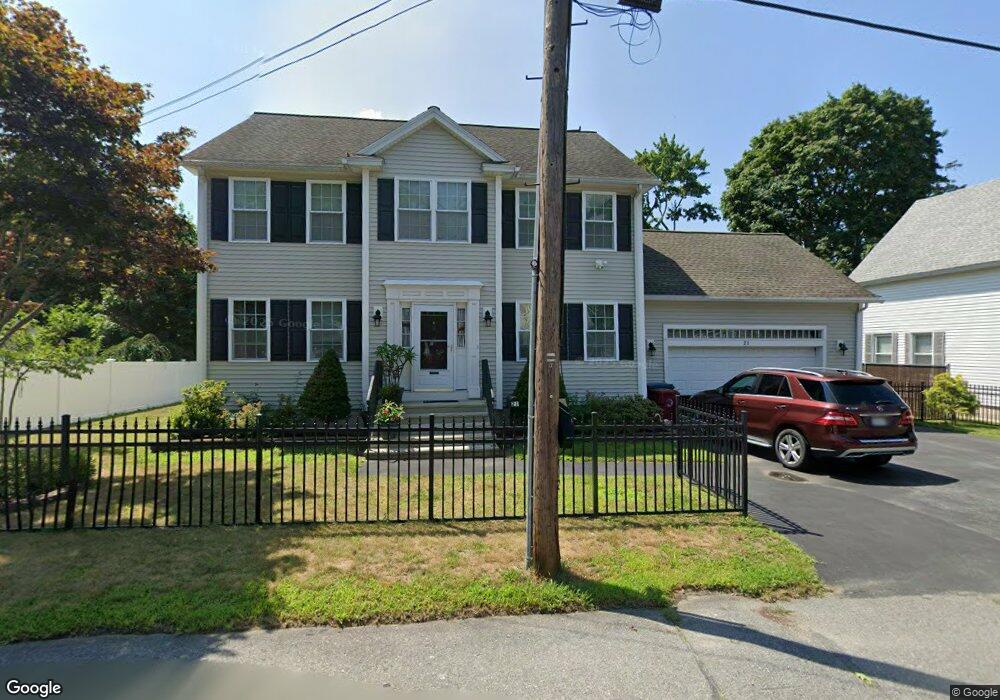
21 Stavely St Lowell, MA 01852
South Lowell NeighborhoodEstimated Value: $633,000 - $697,435
3
Beds
3
Baths
1,944
Sq Ft
$344/Sq Ft
Est. Value
About This Home
This home is located at 21 Stavely St, Lowell, MA 01852 and is currently estimated at $669,109, approximately $344 per square foot. 21 Stavely St is a home located in Middlesex County with nearby schools including Moody Elementary School, Abraham Lincoln Elementary School, and Greenhalge Elementary School.
Ownership History
Date
Name
Owned For
Owner Type
Purchase Details
Closed on
Oct 25, 2011
Sold by
Quality Build & Restorat
Bought by
Masareth Khamsouk and Masareth Souvanna
Current Estimated Value
Home Financials for this Owner
Home Financials are based on the most recent Mortgage that was taken out on this home.
Original Mortgage
$100,000
Outstanding Balance
$68,617
Interest Rate
4.15%
Mortgage Type
Purchase Money Mortgage
Estimated Equity
$600,492
Purchase Details
Closed on
Jun 17, 2011
Sold by
Lambert Claire L and Nicolaisen Patricia M
Bought by
Quality Build & Restor
Home Financials for this Owner
Home Financials are based on the most recent Mortgage that was taken out on this home.
Original Mortgage
$213,450
Interest Rate
4.74%
Mortgage Type
Purchase Money Mortgage
Create a Home Valuation Report for This Property
The Home Valuation Report is an in-depth analysis detailing your home's value as well as a comparison with similar homes in the area
Home Values in the Area
Average Home Value in this Area
Purchase History
| Date | Buyer | Sale Price | Title Company |
|---|---|---|---|
| Masareth Khamsouk | $314,900 | -- | |
| Quality Build & Restor | $80,000 | -- |
Source: Public Records
Mortgage History
| Date | Status | Borrower | Loan Amount |
|---|---|---|---|
| Open | Masareth Khamsouk | $100,000 | |
| Previous Owner | Quality Build & Restor | $213,450 |
Source: Public Records
Tax History Compared to Growth
Tax History
| Year | Tax Paid | Tax Assessment Tax Assessment Total Assessment is a certain percentage of the fair market value that is determined by local assessors to be the total taxable value of land and additions on the property. | Land | Improvement |
|---|---|---|---|---|
| 2025 | $6,934 | $604,000 | $170,000 | $434,000 |
| 2024 | $7,064 | $593,100 | $158,900 | $434,200 |
| 2023 | $6,754 | $543,800 | $138,200 | $405,600 |
| 2022 | $6,233 | $491,200 | $125,600 | $365,600 |
| 2021 | $5,883 | $437,100 | $109,200 | $327,900 |
| 2020 | $5,629 | $421,300 | $103,900 | $317,400 |
| 2019 | $5,723 | $407,600 | $96,200 | $311,400 |
| 2018 | $5,534 | $398,900 | $91,700 | $307,200 |
| 2017 | $5,528 | $370,500 | $83,300 | $287,200 |
| 2016 | $5,503 | $363,000 | $72,800 | $290,200 |
| 2015 | $5,194 | $335,500 | $72,800 | $262,700 |
| 2013 | $4,488 | $299,000 | $90,300 | $208,700 |
Source: Public Records
Map
Nearby Homes
- 45 Woburn St
- 157 Billerica St
- 10 Mission Place
- 79 Eugene St
- 25 Juniper St Unit 21
- 55 Stratham St
- 90 Roper St Unit G
- 50 Arnold Ave
- 106 Lundberg St Unit 6
- 357 Boylston St Unit 2
- 197 Moore St
- 58 Fay St Unit 2
- 21 Bishop St
- 5 Lenox St Unit 2
- 64 S Whipple St
- 106 Park Ave W Unit D9
- 67 Wellington Ave
- 1508 Gorham St Unit 101
- 137 Hoyt Ave
- 1514 Gorham St Unit 5