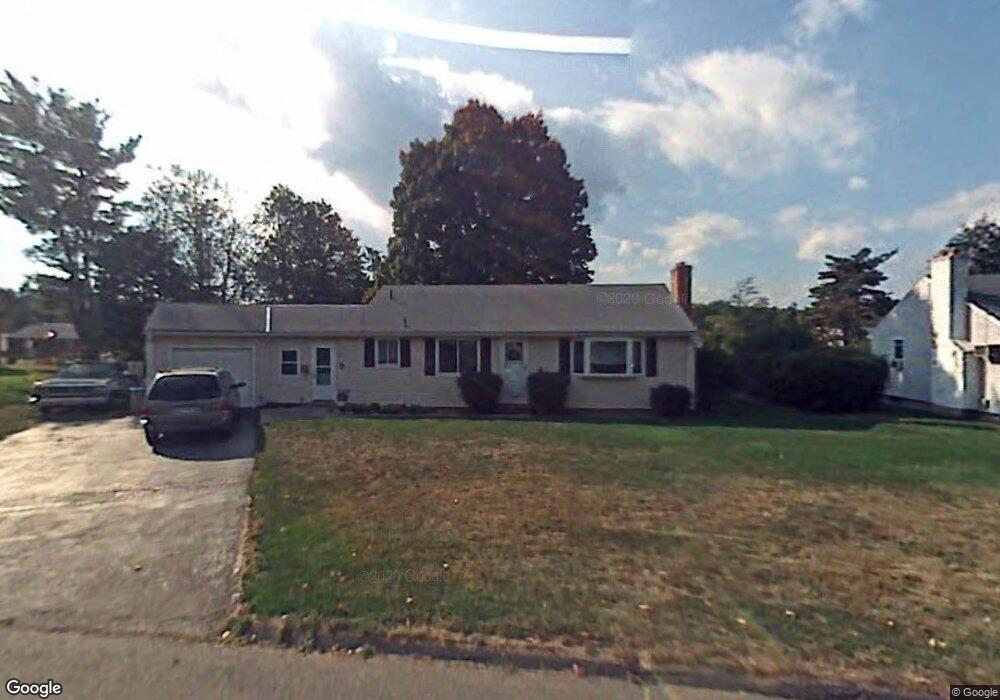
21 Sterling Dr Berlin, CT 06037
Estimated Value: $400,923 - $411,000
3
Beds
3
Baths
1,410
Sq Ft
$288/Sq Ft
Est. Value
About This Home
This home is located at 21 Sterling Dr, Berlin, CT 06037 and is currently estimated at $406,731, approximately $288 per square foot. 21 Sterling Dr is a home located in Hartford County with nearby schools including Mary E. Griswold School, Catherine M. Mcgee Middle School, and Berlin High School.
Ownership History
Date
Name
Owned For
Owner Type
Purchase Details
Closed on
Nov 30, 2009
Sold by
Guerin Russell E
Bought by
Guerin Kristin L
Current Estimated Value
Home Financials for this Owner
Home Financials are based on the most recent Mortgage that was taken out on this home.
Original Mortgage
$188,000
Outstanding Balance
$120,246
Interest Rate
4.92%
Mortgage Type
Purchase Money Mortgage
Estimated Equity
$286,485
Purchase Details
Closed on
Dec 21, 1998
Sold by
Contino David and Contino John J
Bought by
Guerin Kristen L and Guerin Russell E
Create a Home Valuation Report for This Property
The Home Valuation Report is an in-depth analysis detailing your home's value as well as a comparison with similar homes in the area
Home Values in the Area
Average Home Value in this Area
Purchase History
| Date | Buyer | Sale Price | Title Company |
|---|---|---|---|
| Guerin Kristin L | -- | -- | |
| Guerin Kristen L | $122,000 | -- | |
| Guerin Kristen L | $122,000 | -- |
Source: Public Records
Mortgage History
| Date | Status | Borrower | Loan Amount |
|---|---|---|---|
| Open | Guerin Kristen L | $188,000 | |
| Closed | Guerin Kristen L | $188,000 | |
| Previous Owner | Guerin Kristen L | $142,755 | |
| Previous Owner | Guerin Kristen L | $116,800 |
Source: Public Records
Tax History
| Year | Tax Paid | Tax Assessment Tax Assessment Total Assessment is a certain percentage of the fair market value that is determined by local assessors to be the total taxable value of land and additions on the property. | Land | Improvement |
|---|---|---|---|---|
| 2025 | $5,946 | $194,000 | $87,700 | $106,300 |
| 2024 | $5,861 | $194,000 | $87,700 | $106,300 |
| 2023 | $5,735 | $194,000 | $87,700 | $106,300 |
| 2022 | $5,716 | $166,600 | $78,300 | $88,300 |
| 2021 | $5,653 | $166,600 | $78,300 | $88,300 |
| 2020 | $5,653 | $166,600 | $78,300 | $88,300 |
| 2019 | $5,653 | $166,600 | $78,300 | $88,300 |
| 2018 | $5,415 | $166,600 | $78,300 | $88,300 |
| 2017 | $5,092 | $161,100 | $77,600 | $83,500 |
| 2016 | $4,963 | $161,100 | $77,600 | $83,500 |
| 2015 | $4,889 | $161,100 | $77,600 | $83,500 |
| 2014 | $4,219 | $145,900 | $77,600 | $68,300 |
Source: Public Records
Map
Nearby Homes
- 10 Main St Unit 107
- 5 Briar Ln
- 28 Glendale Ave
- 170 Dayl Dr
- 33 Langdon Ct Unit D104
- 266 Farmington Ave
- 51 Towne Dr
- 44 Briar Patch Dr
- 303 New Britain Rd
- 0 Slope South Dr
- 381 Chamberlain Hwy
- 953 High Rd
- 963 High Rd
- 975 High Rd
- 186 Kensington Ave
- 243 Pond St
- 44 Brook St
- 86 Buell St
- 14 Buell St
- 152 Lyons St
Your Personal Tour Guide
Ask me questions while you tour the home.