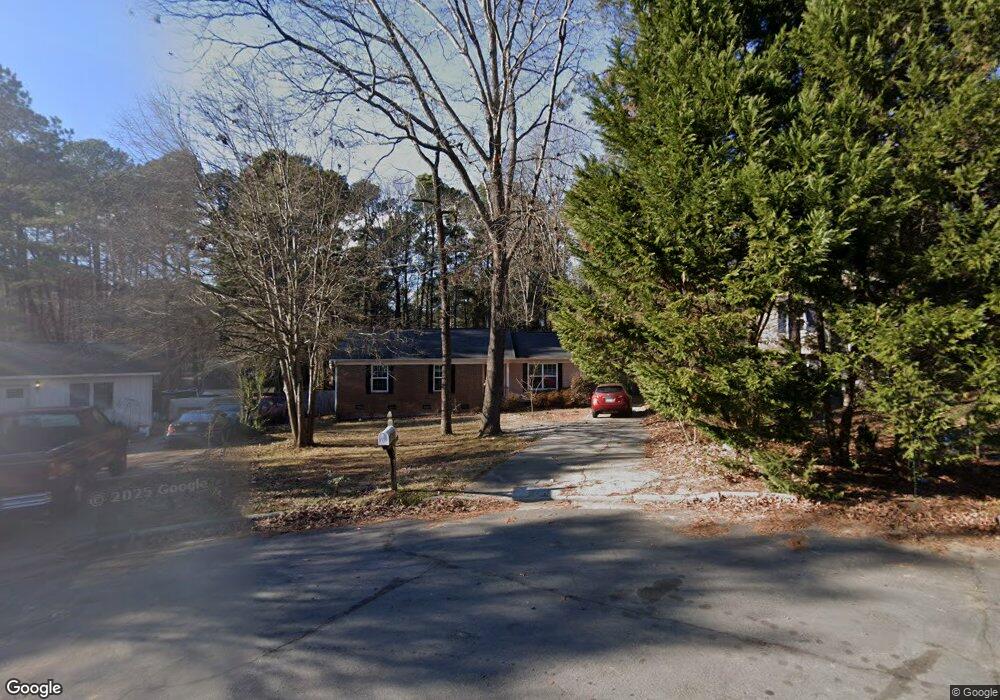
21 Summerglen Ct Durham, NC 27713
Estimated Value: $361,896 - $401,000
3
Beds
2
Baths
1,462
Sq Ft
$264/Sq Ft
Est. Value
About This Home
This home is located at 21 Summerglen Ct, Durham, NC 27713 and is currently estimated at $386,224, approximately $264 per square foot. 21 Summerglen Ct is a home located in Durham County with nearby schools including Parkwood Elementary, Lowe's Grove Middle, and Hillside High School.
Ownership History
Date
Name
Owned For
Owner Type
Purchase Details
Closed on
May 24, 2018
Sold by
E Analytics Holding Llc
Bought by
Li Wanming and Zhang Li
Current Estimated Value
Home Financials for this Owner
Home Financials are based on the most recent Mortgage that was taken out on this home.
Original Mortgage
$150,000
Interest Rate
4.4%
Mortgage Type
New Conventional
Purchase Details
Closed on
Jul 25, 2015
Sold by
Prentis Richard F
Bought by
E Analytics Holding Llc
Home Financials for this Owner
Home Financials are based on the most recent Mortgage that was taken out on this home.
Original Mortgage
$35,000
Interest Rate
4.04%
Mortgage Type
Purchase Money Mortgage
Purchase Details
Closed on
Mar 30, 2010
Sold by
Hinson Alice Jo Yergan
Bought by
Hinson Harold Randy
Purchase Details
Closed on
Jan 6, 1998
Sold by
Hinson Harold Randy
Bought by
Hinson Harold Randy and Hinson Alice Jo Yergan
Create a Home Valuation Report for This Property
The Home Valuation Report is an in-depth analysis detailing your home's value as well as a comparison with similar homes in the area
Home Values in the Area
Average Home Value in this Area
Purchase History
| Date | Buyer | Sale Price | Title Company |
|---|---|---|---|
| Li Wanming | $226,000 | None Available | |
| E Analytics Holding Llc | $77,000 | Attorney | |
| Hinson Harold Randy | -- | None Available | |
| Hinson Harold Randy | -- | -- |
Source: Public Records
Mortgage History
| Date | Status | Borrower | Loan Amount |
|---|---|---|---|
| Previous Owner | Li Wanming | $150,000 | |
| Previous Owner | E Analytics Holding Llc | $35,000 |
Source: Public Records
Tax History Compared to Growth
Tax History
| Year | Tax Paid | Tax Assessment Tax Assessment Total Assessment is a certain percentage of the fair market value that is determined by local assessors to be the total taxable value of land and additions on the property. | Land | Improvement |
|---|---|---|---|---|
| 2025 | $2,714 | $348,575 | $129,000 | $219,575 |
| 2024 | $2,714 | $194,552 | $38,790 | $155,762 |
| 2023 | $2,548 | $194,552 | $38,790 | $155,762 |
| 2022 | $2,490 | $194,552 | $38,790 | $155,762 |
| 2021 | $2,478 | $194,552 | $38,790 | $155,762 |
| 2020 | $2,420 | $194,552 | $38,790 | $155,762 |
| 2019 | $2,420 | $194,552 | $38,790 | $155,762 |
| 2018 | $1,963 | $144,685 | $35,557 | $109,128 |
| 2017 | $1,948 | $144,685 | $35,557 | $109,128 |
| 2016 | $1,793 | $137,775 | $35,557 | $102,218 |
| 2015 | $2,166 | $156,484 | $26,290 | $130,194 |
| 2014 | $2,166 | $156,484 | $26,290 | $130,194 |
Source: Public Records
Map
Nearby Homes
- 20 Summerglen Ct
- 5100 Mccormick Rd
- 6609 Hunters Ln
- 205 Landreth Ct
- 1019 Pondfield Way
- 5 Huckleberry Ct
- 1227 Seaton Rd Unit 54
- 1203 Lotus Lilly Dr
- 1109 Seaton Rd
- 617 Wellingham Dr
- 1335 Catch Fly Ln
- 1021 Park Glen Place
- 9 Monteith Ct
- 1049 Laceflower Dr
- 1304 Seaton Rd Unit 24
- 1107 Rocketcress Dr
- 12 Haycox Ct
- 6304 Amhurst Rd
- 2015 Rooster Spur Ct
- 115 Lattimore Ln
- 19 Summerglen Ct
- 23 Summerglen Ct
- 922 Huntsman Dr
- 15 Summerglen Ct
- 1002 Huntsman Dr
- 22 Summerglen Ct
- 11 Summerglen Ct
- 18 Summerglen Ct
- 107 Bounty Ln
- 16 Summerglen Ct
- 1008 Huntsman Dr
- 918 Huntsman Dr
- 111 Bounty Ln
- 10 Summerglen Ct
- 9 Summerglen Ct
- 5216 Mccormick Rd
- 5212 Mccormick Rd
- 5220 Mccormick Rd
- 8 Summerglen Ct
- 5208 Mccormick Rd