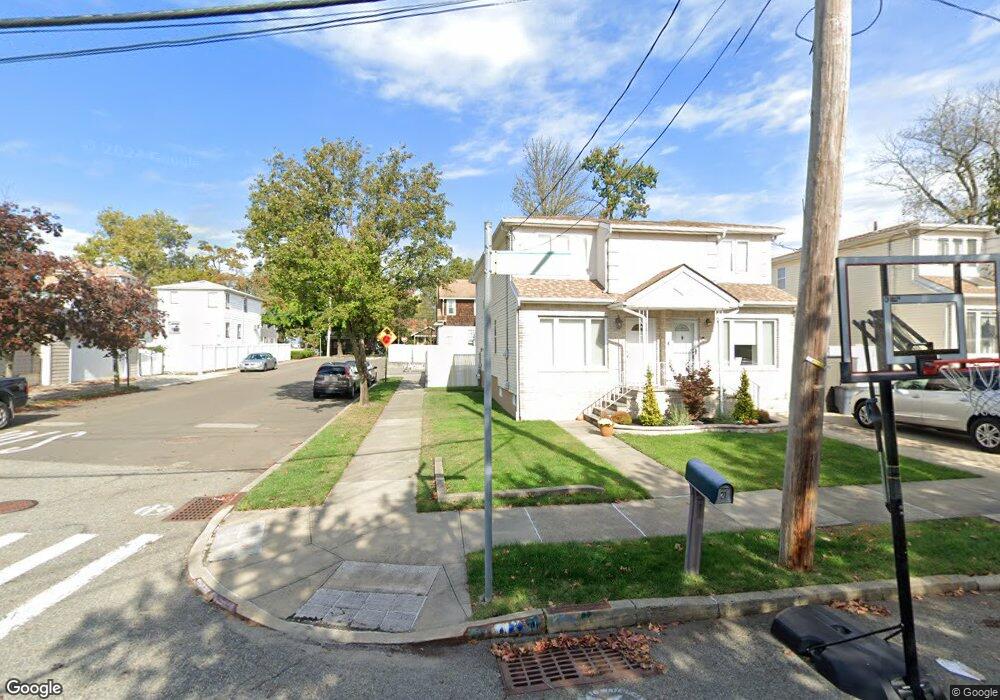
21 Summit Rd Staten Island, NY 10307
Tottenville NeighborhoodEstimated Value: $745,000 - $973,000
3
Beds
3
Baths
2,150
Sq Ft
$391/Sq Ft
Est. Value
About This Home
This home is located at 21 Summit Rd, Staten Island, NY 10307 and is currently estimated at $839,900, approximately $390 per square foot. 21 Summit Rd is a home located in Richmond County with nearby schools including P.S. 1 Tottenville, Is 34 Tottenville, and Tottenville High School.
Ownership History
Date
Name
Owned For
Owner Type
Purchase Details
Closed on
Nov 29, 2004
Sold by
Mccabe Noramary
Bought by
Tagliani Christopher and Tagliani Josephine
Current Estimated Value
Home Financials for this Owner
Home Financials are based on the most recent Mortgage that was taken out on this home.
Original Mortgage
$355,000
Interest Rate
5.73%
Mortgage Type
Fannie Mae Freddie Mac
Purchase Details
Closed on
May 8, 1997
Sold by
Fam Building Corp
Bought by
Mccabe Noramary
Create a Home Valuation Report for This Property
The Home Valuation Report is an in-depth analysis detailing your home's value as well as a comparison with similar homes in the area
Home Values in the Area
Average Home Value in this Area
Purchase History
| Date | Buyer | Sale Price | Title Company |
|---|---|---|---|
| Tagliani Christopher | $390,000 | First Amer Title Ins Co Ny | |
| Mccabe Noramary | $215,000 | -- |
Source: Public Records
Mortgage History
| Date | Status | Borrower | Loan Amount |
|---|---|---|---|
| Previous Owner | Tagliani Christopher | $355,000 |
Source: Public Records
Tax History Compared to Growth
Tax History
| Year | Tax Paid | Tax Assessment Tax Assessment Total Assessment is a certain percentage of the fair market value that is determined by local assessors to be the total taxable value of land and additions on the property. | Land | Improvement |
|---|---|---|---|---|
| 2025 | $7,007 | $45,600 | $7,086 | $38,514 |
| 2024 | $7,019 | $37,740 | $8,077 | $29,663 |
| 2023 | $7,085 | $36,288 | $7,165 | $29,123 |
| 2022 | $6,802 | $36,660 | $8,400 | $28,260 |
| 2021 | $6,847 | $34,740 | $8,400 | $26,340 |
| 2020 | $6,493 | $34,200 | $8,400 | $25,800 |
| 2019 | $7,577 | $33,720 | $8,400 | $25,320 |
| 2018 | $5,867 | $30,240 | $8,141 | $22,099 |
| 2017 | $5,733 | $29,592 | $7,658 | $21,934 |
| 2016 | $5,350 | $28,314 | $8,328 | $19,986 |
| 2015 | $4,531 | $26,712 | $6,976 | $19,736 |
| 2014 | $4,531 | $25,200 | $7,020 | $18,180 |
Source: Public Records
Map
Nearby Homes
- 146 Bentley St
- 162 Bentley St
- 11 Satterlee St
- 7546 Amboy Rd
- 137 Butler Ave
- 30 Aviva Ct
- 2 Wards Point Ave
- 5463-5465 Arthur Kill Rd
- 5463 Arthur Kill Rd Unit 5465
- 5475 Arthur Kill Rd Unit C
- 139 Finlay St
- 153 Carteret St
- 112 Johnson Ave
- 5396 Arthur Kill Rd
- 9 Massachusetts St
- 159 Aspinwall St
- 197 Finlay St
- 236 Lee Ave
- 197 Aspinwall St
- 237 Lee Ave
- 19 Summit Rd
- 17 Summit Rd
- 15 Summit Rd
- 7652 Amboy Rd
- 31 Summit Rd
- 7646 Amboy Rd
- 7660 Amboy Rd
- 10 Aspinwall St
- 8 Aspinwall St
- 12 Aspinwall St
- 6 Aspinwall St
- 27 Finlay St
- 7664 Amboy Rd
- 37 Summit Rd Unit A
- 37 Summit Rd Unit 1
- 37 Summit Rd Unit 2
- 37 Summit Rd
- 14 Aspinwall St
- 7668 Amboy Rd
- 16 Aspinwall St