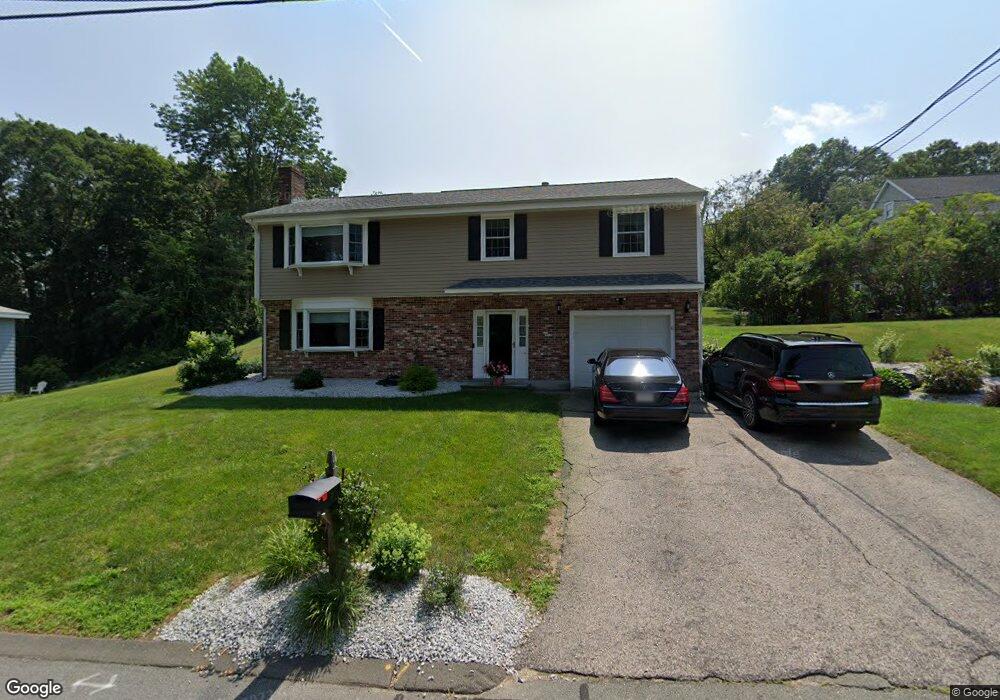
21 Sumner St Burlington, MA 01803
North Burlington NeighborhoodEstimated Value: $860,212 - $1,074,000
3
Beds
2
Baths
2,247
Sq Ft
$424/Sq Ft
Est. Value
About This Home
This home is located at 21 Sumner St, Burlington, MA 01803 and is currently estimated at $953,053, approximately $424 per square foot. 21 Sumner St is a home located in Middlesex County with nearby schools including Burlington High School, Fox Hill, and Marshall Simonds Middle School.
Ownership History
Date
Name
Owned For
Owner Type
Purchase Details
Closed on
Jun 23, 2022
Sold by
Valente Joseph and Valente Ellen
Bought by
Gianacopolis Peter J and Valente Laura A
Current Estimated Value
Home Financials for this Owner
Home Financials are based on the most recent Mortgage that was taken out on this home.
Original Mortgage
$500,000
Outstanding Balance
$473,159
Interest Rate
5.3%
Mortgage Type
Purchase Money Mortgage
Estimated Equity
$479,894
Purchase Details
Closed on
Aug 29, 1980
Bought by
Valente Joseph and Bruce Ellen M
Create a Home Valuation Report for This Property
The Home Valuation Report is an in-depth analysis detailing your home's value as well as a comparison with similar homes in the area
Home Values in the Area
Average Home Value in this Area
Purchase History
| Date | Buyer | Sale Price | Title Company |
|---|---|---|---|
| Gianacopolis Peter J | $800,000 | None Available | |
| Valente Joseph | -- | -- |
Source: Public Records
Mortgage History
| Date | Status | Borrower | Loan Amount |
|---|---|---|---|
| Open | Gianacopolis Peter J | $500,000 | |
| Previous Owner | Valente Joseph | $61,000 |
Source: Public Records
Tax History
| Year | Tax Paid | Tax Assessment Tax Assessment Total Assessment is a certain percentage of the fair market value that is determined by local assessors to be the total taxable value of land and additions on the property. | Land | Improvement |
|---|---|---|---|---|
| 2025 | $6,745 | $778,900 | $425,100 | $353,800 |
| 2024 | $6,567 | $734,600 | $403,100 | $331,500 |
| 2023 | $6,241 | $663,900 | $350,100 | $313,800 |
| 2022 | $6,125 | $615,600 | $319,100 | $296,500 |
| 2021 | $5,837 | $586,600 | $290,100 | $296,500 |
| 2020 | $5,655 | $586,600 | $290,100 | $296,500 |
| 2019 | $5,615 | $535,800 | $271,100 | $264,700 |
| 2018 | $5,175 | $487,300 | $258,100 | $229,200 |
| 2017 | $5,091 | $487,300 | $258,100 | $229,200 |
| 2016 | $5,053 | $440,900 | $220,100 | $220,800 |
| 2015 | $5,004 | $440,900 | $220,100 | $220,800 |
| 2014 | $4,892 | $407,700 | $200,100 | $207,600 |
Source: Public Records
Map
Nearby Homes
- 29 Beaverbrook Rd
- 14 Sarah St
- 23 Rocky Hill Rd
- 6 Jonathan Rd
- 255 Burlington Ave
- 25 Mill Rd
- 224 Burlington Ave
- 23 Wilmington Rd
- 20 Alma Rd
- 6 Patricia Cir
- 12 Murray Ave Unit 18
- 345 Cambridge St
- 44 Connolly Rd
- 0 Bedford St
- 23 County Rd
- 1 Joanne Rd
- 6 Glade St
- 13 Makechnie Rd
- 27 Purity Springs Rd
- 41 Glenvale Ave
Your Personal Tour Guide
Ask me questions while you tour the home.