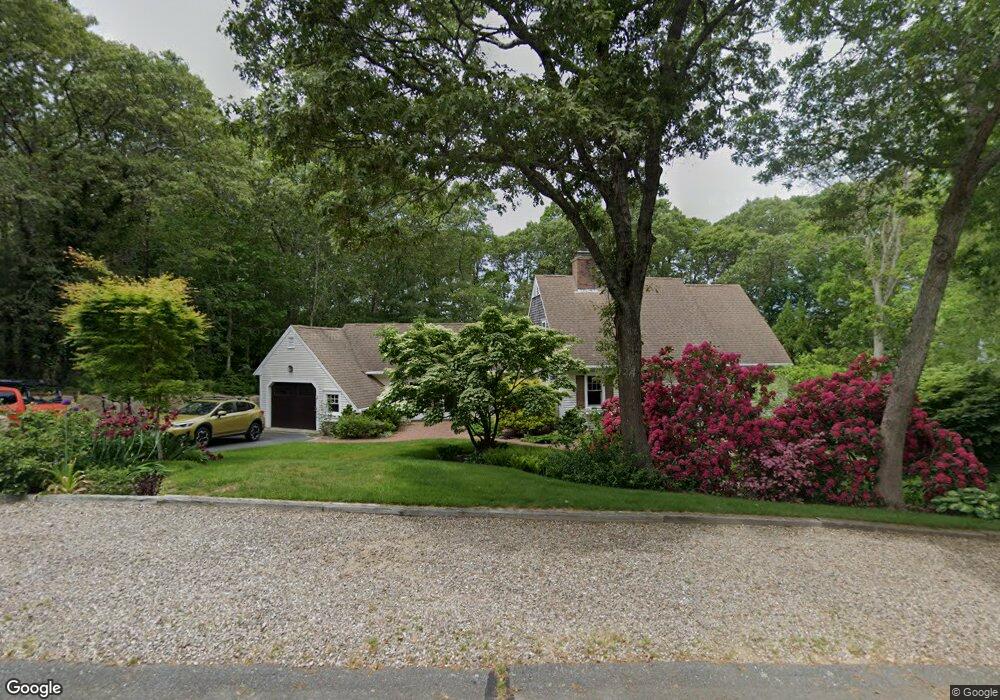
21 Surrey Ln Barnstable, MA 02630
Barnstable Village NeighborhoodEstimated Value: $829,513 - $1,111,000
3
Beds
2
Baths
1,872
Sq Ft
$502/Sq Ft
Est. Value
About This Home
This home is located at 21 Surrey Ln, Barnstable, MA 02630 and is currently estimated at $940,128, approximately $502 per square foot. 21 Surrey Ln is a home located in Barnstable County with nearby schools including West Barnstable Elementary School, Barnstable United Elementary School, and Barnstable Intermediate School.
Ownership History
Date
Name
Owned For
Owner Type
Purchase Details
Closed on
Jul 30, 2009
Sold by
Harry M Hilton T
Bought by
Cerutti Miriam J
Current Estimated Value
Home Financials for this Owner
Home Financials are based on the most recent Mortgage that was taken out on this home.
Original Mortgage
$342,000
Outstanding Balance
$225,475
Interest Rate
5.43%
Mortgage Type
Purchase Money Mortgage
Estimated Equity
$714,653
Create a Home Valuation Report for This Property
The Home Valuation Report is an in-depth analysis detailing your home's value as well as a comparison with similar homes in the area
Home Values in the Area
Average Home Value in this Area
Purchase History
| Date | Buyer | Sale Price | Title Company |
|---|---|---|---|
| Cerutti Miriam J | $380,000 | -- |
Source: Public Records
Mortgage History
| Date | Status | Borrower | Loan Amount |
|---|---|---|---|
| Open | Cerutti Miriam J | $342,000 |
Source: Public Records
Tax History
| Year | Tax Paid | Tax Assessment Tax Assessment Total Assessment is a certain percentage of the fair market value that is determined by local assessors to be the total taxable value of land and additions on the property. | Land | Improvement |
|---|---|---|---|---|
| 2025 | $7,120 | $770,600 | $180,700 | $589,900 |
| 2024 | $6,416 | $732,400 | $180,700 | $551,700 |
| 2023 | $5,999 | $668,000 | $178,600 | $489,400 |
| 2022 | $6,057 | $542,700 | $127,000 | $415,700 |
| 2021 | $5,689 | $485,800 | $127,000 | $358,800 |
| 2020 | $5,668 | $462,300 | $127,000 | $335,300 |
| 2019 | $5,195 | $425,100 | $127,000 | $298,100 |
| 2018 | $5,027 | $399,600 | $139,300 | $260,300 |
| 2017 | $4,836 | $386,900 | $139,300 | $247,600 |
| 2016 | $4,676 | $379,200 | $140,600 | $238,600 |
| 2015 | $4,119 | $340,100 | $110,300 | $229,800 |
Source: Public Records
Map
Nearby Homes
- 34 Maushop Ave
- 0 Indian Trail
- 43 Sturgis Ln
- 30 Indian Trail
- 79 Bayberry Ln
- 44 Iris Ln
- 218 Oakmont Rd
- 93 Harris Meadow Ln
- 69 Allyn Ln
- 97 Oakmont Dr
- 2656 Main St
- 93 Oakmont Dr Unit Lot 2
- 157 Scudder's Ln
- 65 Oakmont Rd
- 11 Shepherds Way
- 122 Stoney Cove Ln
- 8 Captain Cook Ln Unit 8
- 8 Captain Cook Ln Unit 8
- 4332 Main St
- 800 Bearses Way Unit 2ED
Your Personal Tour Guide
Ask me questions while you tour the home.