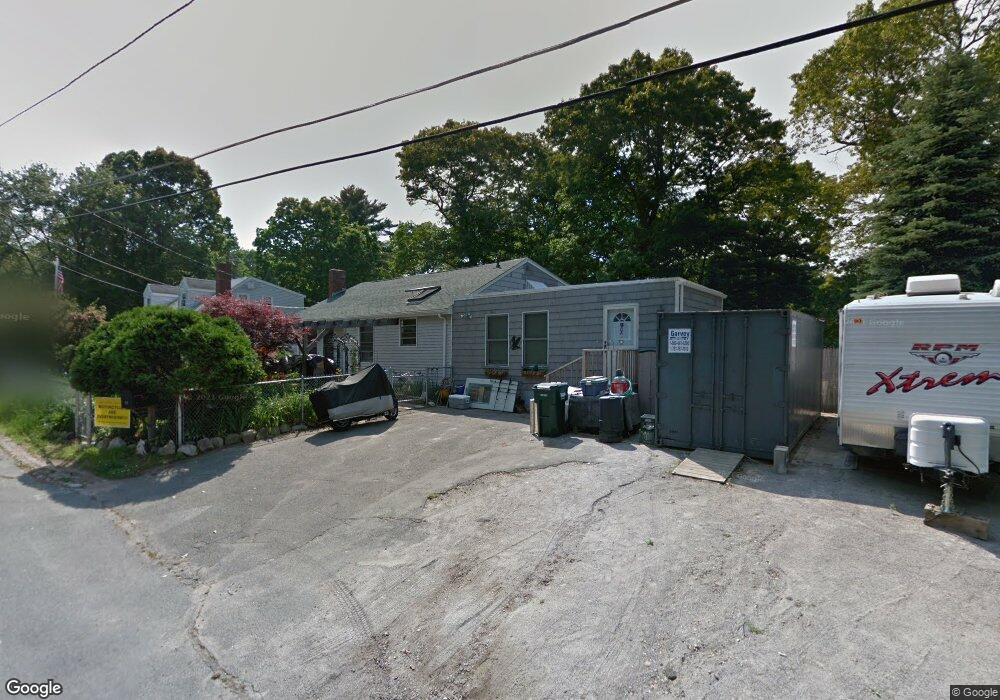
21 Sylvan Rd Holbrook, MA 02343
Estimated Value: $497,000 - $552,000
4
Beds
1
Bath
1,578
Sq Ft
$334/Sq Ft
Est. Value
About This Home
This home is located at 21 Sylvan Rd, Holbrook, MA 02343 and is currently estimated at $526,465, approximately $333 per square foot. 21 Sylvan Rd is a home located in Norfolk County with nearby schools including John F. Kennedy Elementary School, Holbrook Middle High School, and Boston Higashi School.
Ownership History
Date
Name
Owned For
Owner Type
Purchase Details
Closed on
Apr 12, 2019
Sold by
Fogg Mary J
Bought by
Fogg Nathan
Current Estimated Value
Purchase Details
Closed on
Nov 7, 1980
Bought by
Fogg Mary J
Create a Home Valuation Report for This Property
The Home Valuation Report is an in-depth analysis detailing your home's value as well as a comparison with similar homes in the area
Home Values in the Area
Average Home Value in this Area
Purchase History
| Date | Buyer | Sale Price | Title Company |
|---|---|---|---|
| Fogg Nathan | -- | -- | |
| Fogg Nathan | -- | -- | |
| Fogg Nathan | -- | -- | |
| Fogg Mary J | -- | -- |
Source: Public Records
Mortgage History
| Date | Status | Borrower | Loan Amount |
|---|---|---|---|
| Previous Owner | Fogg Mary J | $67,000 | |
| Previous Owner | Fogg Mary J | $61,000 | |
| Previous Owner | Fogg Mary J | $35,000 |
Source: Public Records
Tax History Compared to Growth
Tax History
| Year | Tax Paid | Tax Assessment Tax Assessment Total Assessment is a certain percentage of the fair market value that is determined by local assessors to be the total taxable value of land and additions on the property. | Land | Improvement |
|---|---|---|---|---|
| 2025 | $56 | $427,200 | $206,500 | $220,700 |
| 2024 | $5,696 | $423,800 | $206,300 | $217,500 |
| 2023 | $6,037 | $392,500 | $187,600 | $204,900 |
| 2022 | $5,610 | $340,200 | $170,500 | $169,700 |
| 2021 | $5,478 | $318,100 | $154,700 | $163,400 |
| 2020 | $5,689 | $309,700 | $150,000 | $159,700 |
| 2019 | $5,608 | $288,200 | $140,400 | $147,800 |
| 2018 | $5,641 | $272,900 | $130,000 | $142,900 |
| 2017 | $5,348 | $255,900 | $118,000 | $137,900 |
| 2016 | $4,894 | $249,200 | $115,000 | $134,200 |
| 2015 | $4,587 | $240,400 | $110,000 | $130,400 |
| 2014 | $4,443 | $236,700 | $110,000 | $126,700 |
Source: Public Records
Map
Nearby Homes
- 25 Valley Rd
- 28 Border Rd
- 13 Mayflower Rd
- 27 Ell Rd
- 40 Overlook Rd
- 14 Fern Rd
- 45 King Rd
- 58 Woodlawn Rd
- 68 Spring St
- 375 S Franklin St Unit 1
- 0 Payson Ave
- 15 Payson Ave
- 43 Toscano Way Unit 43
- 4 Evan Cain Way
- 7 Oakwood Ave
- 9 Madison Ave
- 35 Marion St
- 719 S Franklin St Unit L Block 1
- 719 S Franklin St Unit D Block 1
- 719 S Franklin St Unit C Block 1