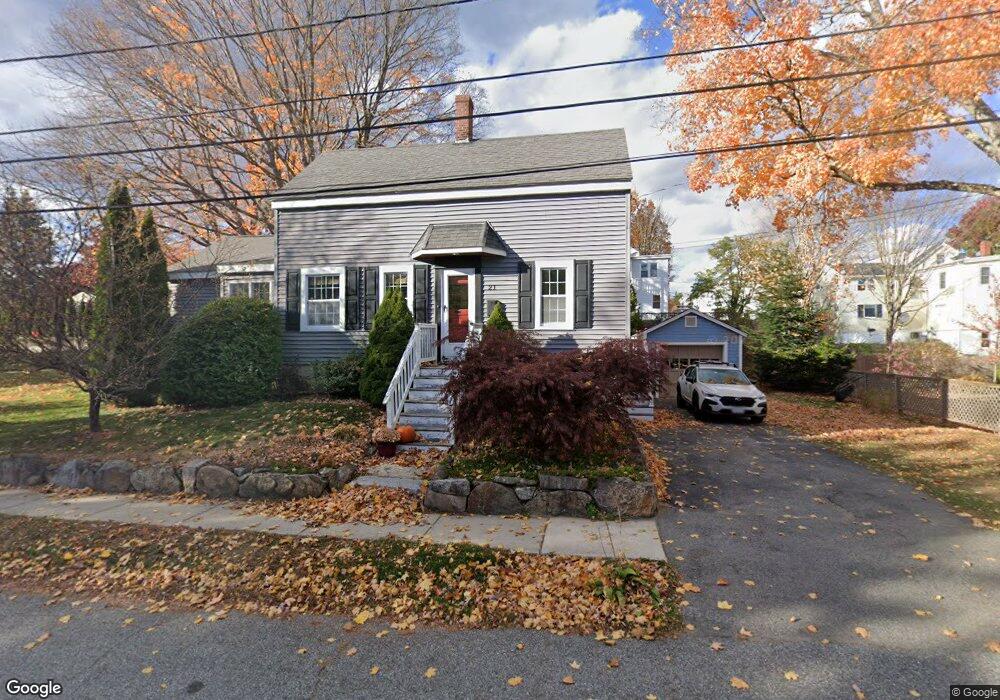
21 Thompson St Amesbury, MA 01913
Estimated Value: $434,000 - $612,000
2
Beds
1
Bath
879
Sq Ft
$612/Sq Ft
Est. Value
About This Home
This home is located at 21 Thompson St, Amesbury, MA 01913 and is currently estimated at $537,660, approximately $611 per square foot. 21 Thompson St is a home located in Essex County with nearby schools including Amesbury High School and Amesbury Seventh-Day Adventist School.
Ownership History
Date
Name
Owned For
Owner Type
Purchase Details
Closed on
May 5, 2010
Sold by
Marcinik Daniel V
Bought by
Marcinik Anne
Current Estimated Value
Home Financials for this Owner
Home Financials are based on the most recent Mortgage that was taken out on this home.
Original Mortgage
$219,500
Interest Rate
5.03%
Purchase Details
Closed on
Jul 8, 2004
Sold by
Allen Deborah and Allen Mitchell
Bought by
Marcinik Daniel V and Marcinik Anne M
Purchase Details
Closed on
May 10, 2002
Sold by
Ryan Joanne
Bought by
Allen Mitchell D and Allen Deborah
Purchase Details
Closed on
Jun 29, 1995
Sold by
Weyland Janice C
Bought by
Ryan Joanne
Purchase Details
Closed on
Dec 21, 1990
Sold by
Carey Mary R
Bought by
Hume Janice C
Create a Home Valuation Report for This Property
The Home Valuation Report is an in-depth analysis detailing your home's value as well as a comparison with similar homes in the area
Home Values in the Area
Average Home Value in this Area
Purchase History
| Date | Buyer | Sale Price | Title Company |
|---|---|---|---|
| Marcinik Anne | -- | -- | |
| Marcinik Daniel V | $275,000 | -- | |
| Allen Mitchell D | $195,400 | -- | |
| Ryan Joanne | $97,000 | -- | |
| Hume Janice C | $98,000 | -- |
Source: Public Records
Mortgage History
| Date | Status | Borrower | Loan Amount |
|---|---|---|---|
| Open | Hume Janice C | $218,500 | |
| Closed | Hume Janice C | $219,500 | |
| Previous Owner | Hume Janice C | $232,000 |
Source: Public Records
Tax History Compared to Growth
Tax History
| Year | Tax Paid | Tax Assessment Tax Assessment Total Assessment is a certain percentage of the fair market value that is determined by local assessors to be the total taxable value of land and additions on the property. | Land | Improvement |
|---|---|---|---|---|
| 2025 | $7,431 | $485,700 | $205,500 | $280,200 |
| 2024 | $7,154 | $457,400 | $193,800 | $263,600 |
| 2023 | $7,061 | $432,100 | $168,500 | $263,600 |
| 2022 | $6,466 | $365,500 | $146,600 | $218,900 |
| 2021 | $6,121 | $335,400 | $113,200 | $222,200 |
| 2020 | $5,273 | $306,900 | $108,800 | $198,100 |
| 2019 | $5,291 | $288,000 | $108,800 | $179,200 |
| 2018 | $5,131 | $270,200 | $103,700 | $166,500 |
| 2017 | $4,926 | $246,900 | $103,700 | $143,200 |
| 2016 | $4,920 | $242,600 | $103,700 | $138,900 |
| 2015 | $4,839 | $235,600 | $103,700 | $131,900 |
| 2014 | $4,666 | $222,500 | $103,700 | $118,800 |
Source: Public Records
Map
Nearby Homes
- 4 Winter St
- 37 Millyard Unit 204
- 93 Friend St
- 13 High St Unit 2
- 48 Orchard St
- 4 Clark St
- 129 Friend St
- 3 Arlington St
- 5 Richs Ct Unit 3
- 101 Market St Unit B
- 101 Market St Unit A
- 25 Cedar St Unit 4
- 25 Cedar St Unit 14
- 25 Cedar St Unit 7
- 25 Cedar St Unit 3
- 105 Market St Unit B
- 97 Elm St
- 118 Elm St
- 31 Whitter Meadows Dr Unit 31
- 18 E Greenwood St