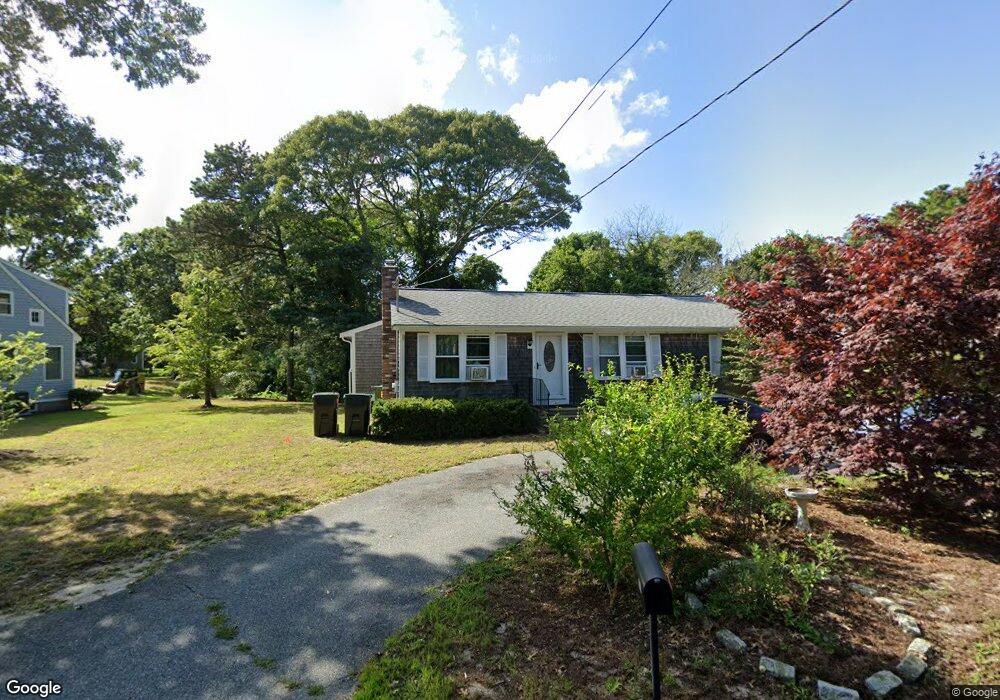
21 Tower Rd West Dennis, MA 02670
West Dennis NeighborhoodEstimated Value: $632,998 - $704,000
3
Beds
2
Baths
1,001
Sq Ft
$657/Sq Ft
Est. Value
About This Home
This home is located at 21 Tower Rd, West Dennis, MA 02670 and is currently estimated at $658,000, approximately $657 per square foot. 21 Tower Rd is a home located in Barnstable County with nearby schools including Dennis-Yarmouth Regional High School and St. Pius X. School.
Ownership History
Date
Name
Owned For
Owner Type
Purchase Details
Closed on
Jan 13, 2010
Sold by
Gildea James H and Gildea Carol A C
Bought by
Carol A C Gildea T
Current Estimated Value
Purchase Details
Closed on
Dec 10, 2003
Sold by
Curley Joseph R and Curley Dianne M
Bought by
Gildea James H and Gildea Carol A
Purchase Details
Closed on
Sep 8, 1997
Sold by
Sawyer Janice L and Sawyer Thomas F
Bought by
Curley Joseph R and Curley Dianne M
Home Financials for this Owner
Home Financials are based on the most recent Mortgage that was taken out on this home.
Original Mortgage
$80,000
Interest Rate
7.36%
Mortgage Type
Purchase Money Mortgage
Create a Home Valuation Report for This Property
The Home Valuation Report is an in-depth analysis detailing your home's value as well as a comparison with similar homes in the area
Home Values in the Area
Average Home Value in this Area
Purchase History
| Date | Buyer | Sale Price | Title Company |
|---|---|---|---|
| Carol A C Gildea T | -- | -- | |
| Gildea James H | $100,000 | -- | |
| Curley Joseph R | $100,000 | -- |
Source: Public Records
Mortgage History
| Date | Status | Borrower | Loan Amount |
|---|---|---|---|
| Previous Owner | Curley Joseph R | $80,000 |
Source: Public Records
Tax History Compared to Growth
Tax History
| Year | Tax Paid | Tax Assessment Tax Assessment Total Assessment is a certain percentage of the fair market value that is determined by local assessors to be the total taxable value of land and additions on the property. | Land | Improvement |
|---|---|---|---|---|
| 2025 | $2,595 | $599,400 | $198,300 | $401,100 |
| 2024 | $2,480 | $564,900 | $190,700 | $374,200 |
| 2023 | $2,418 | $517,700 | $173,400 | $344,300 |
| 2022 | $2,194 | $391,800 | $135,400 | $256,400 |
| 2021 | $9,870 | $366,600 | $132,700 | $233,900 |
| 2020 | $2,152 | $352,800 | $142,900 | $209,900 |
| 2019 | $2,145 | $347,700 | $150,100 | $197,600 |
| 2018 | $9,403 | $312,800 | $133,400 | $179,400 |
| 2017 | $9,547 | $307,100 | $133,400 | $173,700 |
| 2016 | $1,847 | $282,800 | $138,200 | $144,600 |
| 2015 | $1,485 | $232,000 | $138,200 | $93,800 |
| 2014 | $1,473 | $232,000 | $138,200 | $93,800 |
Source: Public Records
Map
Nearby Homes
- 12 Spoonbill Rd
- 15 Woodside Park Rd
- 26 Center St
- 3 Pinefield Ln
- 95 Center St
- 71 Main St
- 4 Coffey Ln
- 19 Standish Way
- 80 Michaels Ave
- 125 Main St Unit 3
- 61 Trotters Ln
- 22 Wixon Rd
- 467 Main St
- 72 Bassett Ln
- 268 Main St
- 31 Easy St
- 20 Aunt Debbys Rd
- 401 Main St Unit 201
- 401 Main St Unit 101
- 37 Ocean Dr Unit 2