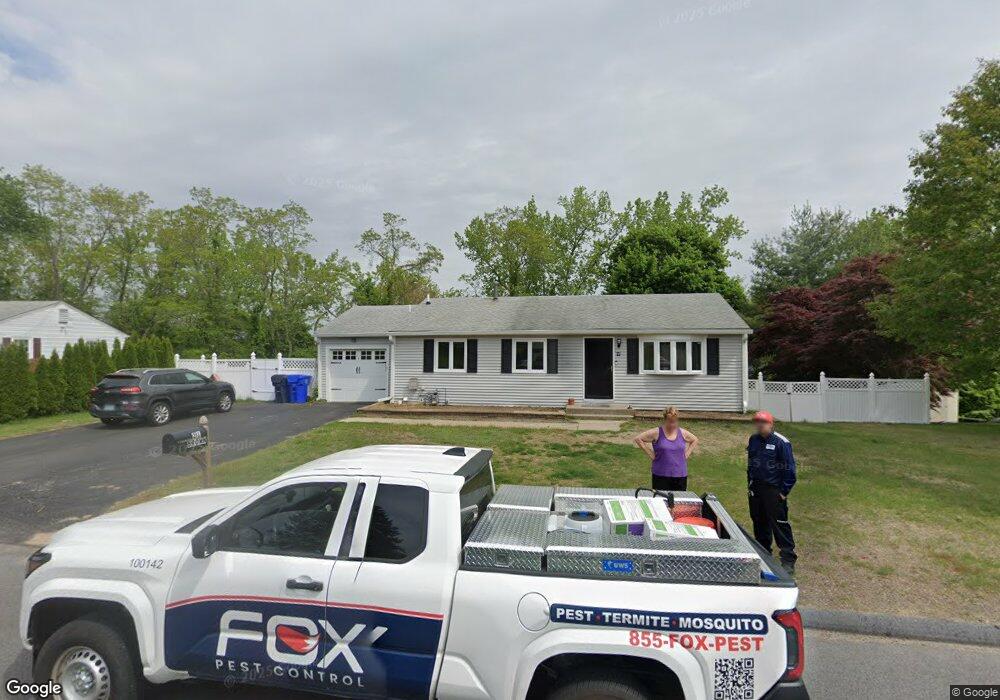
21 Tower Rd West Warwick, RI 02893
West Warwick Centre NeighborhoodEstimated Value: $388,000 - $470,000
3
Beds
1
Bath
1,820
Sq Ft
$239/Sq Ft
Est. Value
About This Home
This home is located at 21 Tower Rd, West Warwick, RI 02893 and is currently estimated at $435,754, approximately $239 per square foot. 21 Tower Rd is a home located in Kent County with nearby schools including West Warwick High School, Islamic School of Rhode Island, and St Joseph School.
Ownership History
Date
Name
Owned For
Owner Type
Purchase Details
Closed on
Apr 22, 2021
Sold by
Brown Timothy G and Brown Lisa R
Bought by
Brown Timothy G and Brown Lisa R
Current Estimated Value
Home Financials for this Owner
Home Financials are based on the most recent Mortgage that was taken out on this home.
Original Mortgage
$222,500
Interest Rate
3.1%
Mortgage Type
New Conventional
Purchase Details
Closed on
Aug 18, 1998
Sold by
Carneiro Denise M
Bought by
Brown Timothy G
Create a Home Valuation Report for This Property
The Home Valuation Report is an in-depth analysis detailing your home's value as well as a comparison with similar homes in the area
Home Values in the Area
Average Home Value in this Area
Purchase History
| Date | Buyer | Sale Price | Title Company |
|---|---|---|---|
| Brown Timothy G | -- | None Available | |
| Brown Timothy G | -- | None Available | |
| Brown Timothy G | $90,000 | -- |
Source: Public Records
Mortgage History
| Date | Status | Borrower | Loan Amount |
|---|---|---|---|
| Previous Owner | Brown Timothy G | $222,500 | |
| Previous Owner | Brown Timothy G | $212,000 | |
| Previous Owner | Brown Timothy G | $39,000 | |
| Previous Owner | Brown Timothy G | $212,000 |
Source: Public Records
Tax History
| Year | Tax Paid | Tax Assessment Tax Assessment Total Assessment is a certain percentage of the fair market value that is determined by local assessors to be the total taxable value of land and additions on the property. | Land | Improvement |
|---|---|---|---|---|
| 2025 | $5,260 | $368,100 | $115,600 | $252,500 |
| 2024 | $5,071 | $271,300 | $82,700 | $188,600 |
| 2023 | $4,970 | $271,300 | $82,700 | $188,600 |
| 2022 | $4,894 | $271,300 | $82,700 | $188,600 |
| 2021 | $4,556 | $198,100 | $61,100 | $137,000 |
| 2020 | $4,556 | $198,100 | $61,100 | $137,000 |
| 2019 | $5,808 | $198,100 | $61,100 | $137,000 |
| 2018 | $3,868 | $142,300 | $50,200 | $92,100 |
| 2017 | $3,744 | $142,300 | $50,200 | $92,100 |
| 2016 | $3,677 | $142,300 | $50,200 | $92,100 |
| 2015 | $3,590 | $138,300 | $50,200 | $88,100 |
| 2014 | $3,511 | $138,300 | $50,200 | $88,100 |
Source: Public Records
Map
Nearby Homes
- 93 Tanglewood Dr
- 351 New London Ave Unit 408
- 351 New London Ave Unit 304
- 351 New London Ave Unit 302
- 29 Brayton St
- 61 Lafayette St
- 30 Potter Ave
- 52 Earl St
- 40 Youngs Ave
- 84 Crestwood Dr
- 25 Eddy St
- 479 Providence St Unit C4
- 5 Carr's Ln
- 7 Carr's Ln
- 9 Carr's Ln
- 8 Carr's Ln
- 10 Hall St
- 12 W Valley Cir
- 777 Main St
- 5 Cyr Ct
Your Personal Tour Guide
Ask me questions while you tour the home.