Estimated Value: $227,578 - $298,000
3
Beds
2
Baths
--
Sq Ft
1.02
Acres
About This Home
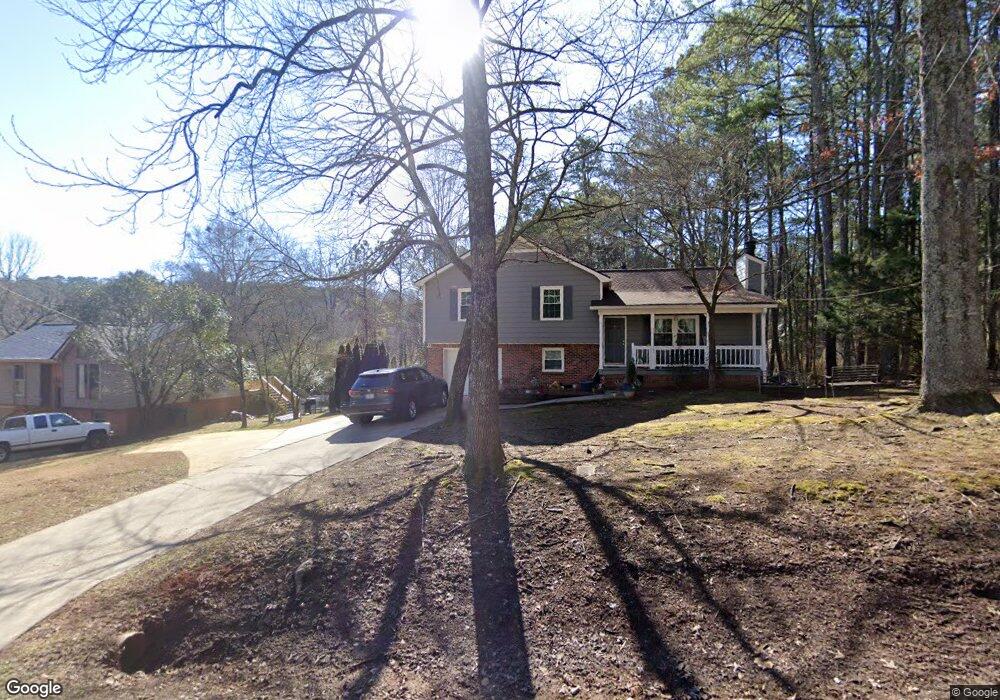
This home is located at 21 Twickenham Rd SE, Rome, GA 30161 and is currently estimated at $267,645. 21 Twickenham Rd SE is a home located in Floyd County with nearby schools including Rome High School, Montessori School of Rome, and St. Mary School.
Ownership History
Date
Name
Owned For
Owner Type
Purchase Details
Closed on
Feb 25, 2002
Sold by
Stuckey John M
Bought by
Harrell Benjamin L and Harrell Lani S
Current Estimated Value
Purchase Details
Closed on
May 30, 1997
Sold by
Wright Robert W and Wright Barbara V
Bought by
Stuckey John M
Purchase Details
Closed on
Feb 24, 1995
Sold by
Davis Kelly S
Bought by
Wright Robert W and Wright Barbara V
Purchase Details
Closed on
Jan 12, 1994
Sold by
Stephenson Randolph
Bought by
Davis Kelly S
Purchase Details
Closed on
Nov 29, 1982
Sold by
Home Service Corporation Of Rome
Bought by
Stephenson Randolph
Purchase Details
Closed on
Sep 9, 1982
Sold by
Owens James R
Bought by
Home Service Corporation Of Rome
Purchase Details
Closed on
Dec 20, 1979
Sold by
Taylor J Raine
Bought by
Owens James R
Purchase Details
Closed on
Jun 16, 1978
Sold by
Hitchock James O
Bought by
Taylor J Raine
Purchase Details
Closed on
Oct 8, 1976
Bought by
Hitchock James O
Create a Home Valuation Report for This Property
The Home Valuation Report is an in-depth analysis detailing your home's value as well as a comparison with similar homes in the area
Home Values in the Area
Average Home Value in this Area
Purchase History
| Date | Buyer | Sale Price | Title Company |
|---|---|---|---|
| Harrell Benjamin L | $107,700 | -- | |
| Stuckey John M | $96,000 | -- | |
| Wright Robert W | $84,900 | -- | |
| Davis Kelly S | $65,500 | -- | |
| Stephenson Randolph | -- | -- | |
| Home Service Corporation Of Rome | $15,500 | -- | |
| Owens James R | $49,500 | -- | |
| Taylor J Raine | $3,000 | -- | |
| Hitchock James O | $4,400 | -- |
Source: Public Records
Tax History Compared to Growth
Tax History
| Year | Tax Paid | Tax Assessment Tax Assessment Total Assessment is a certain percentage of the fair market value that is determined by local assessors to be the total taxable value of land and additions on the property. | Land | Improvement |
|---|---|---|---|---|
| 2024 | $2,925 | $84,236 | $13,141 | $71,095 |
| 2023 | $2,983 | $77,596 | $11,681 | $65,915 |
| 2022 | $2,363 | $64,763 | $9,491 | $55,272 |
| 2021 | $2,189 | $58,981 | $8,761 | $50,220 |
| 2020 | $1,941 | $51,869 | $6,936 | $44,933 |
| 2019 | $1,731 | $46,777 | $6,936 | $39,841 |
| 2018 | $1,653 | $44,664 | $6,936 | $37,728 |
| 2017 | $1,613 | $43,570 | $6,936 | $36,634 |
| 2016 | $1,595 | $42,960 | $6,880 | $36,080 |
| 2015 | $1,521 | $43,364 | $6,880 | $36,484 |
| 2014 | $1,521 | $43,364 | $6,880 | $36,484 |
Source: Public Records
Map
Nearby Homes
- 14 Wellington Way SE
- 18 Wellington Way SE
- 11 Cambridge Dr SE
- 0 Wellington Way SE Unit 7374604
- 0 Wellington Way SE Unit 7374602
- 0 Wellington Way SE Unit 20180069
- 0 Wellington Way SE Unit 20180068
- 38 Coventry Dr SE
- 36 Coventry Dr SE
- 85 Cambridge Dr SE
- 35 Cumberland Dr SE
- 52 Twickenham Rd SE
- 22 Coventry Dr SE
- 519 Dr SE
- 211 Chateau Dr SE
- 20 Coventry Dr SE
- 18 Devonshire Dr SE
- 14 Warwick Way SE
- 20 Warwick Way SE
- 0 Warwick Way SE Unit 7666193
- 19 Twickenham Rd SE
- 23 Twickenham Rd SE
- 18 Twickenham Rd SE
- 20 Twickenham Rd SE
- 24 Twickenham Rd SE
- 8 Margo Trail SE
- 26 Twickenham Rd SE
- 6 Margo Trail SE
- 10 Margo Trail SE
- 22 Twickenham Rd SE
- 28 Twickenham Rd SE
- 28 Twickenham Rd SE
- 28 Twickenham Rd SE Unit 200
- 12 Margo Trail SE
- 12 Margo Trail SE Unit Tr
- 2 Margo Trail SE
- 14 Margo Trail SE
- 9 Wellington Way SE
- 9 Old Twickenham Rd SE
- 10 Twin Ct SE