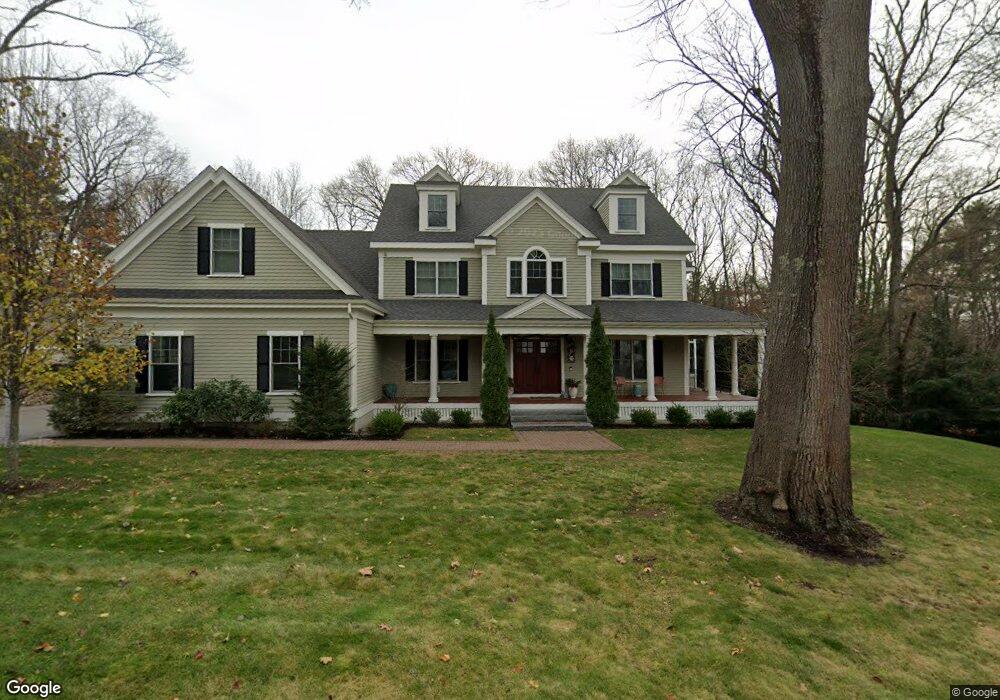
21 Tyler Rd Lexington, MA 02420
Countryside NeighborhoodEstimated Value: $3,236,710 - $4,074,000
5
Beds
5
Baths
5,450
Sq Ft
$677/Sq Ft
Est. Value
About This Home
This home is located at 21 Tyler Rd, Lexington, MA 02420 and is currently estimated at $3,690,428, approximately $677 per square foot. 21 Tyler Rd is a home located in Middlesex County with nearby schools including Harrington Elementary School, Jonas Clarke Middle School, and Lexington High School.
Ownership History
Date
Name
Owned For
Owner Type
Purchase Details
Closed on
Aug 27, 2014
Sold by
21 Tyler Road Llc
Bought by
Shah Kavita D and Shah Devang A
Current Estimated Value
Home Financials for this Owner
Home Financials are based on the most recent Mortgage that was taken out on this home.
Original Mortgage
$925,000
Outstanding Balance
$677,124
Interest Rate
3%
Mortgage Type
Adjustable Rate Mortgage/ARM
Estimated Equity
$3,013,304
Purchase Details
Closed on
Oct 31, 2013
Sold by
Maddox Buford J
Bought by
21 Tyler Road Llc
Home Financials for this Owner
Home Financials are based on the most recent Mortgage that was taken out on this home.
Original Mortgage
$1,295,000
Interest Rate
4.52%
Mortgage Type
Purchase Money Mortgage
Create a Home Valuation Report for This Property
The Home Valuation Report is an in-depth analysis detailing your home's value as well as a comparison with similar homes in the area
Home Values in the Area
Average Home Value in this Area
Purchase History
| Date | Buyer | Sale Price | Title Company |
|---|---|---|---|
| Shah Kavita D | $1,867,242 | -- | |
| 21 Tyler Road Llc | $720,000 | -- | |
| 21 Tyler Road Llc | $720,000 | -- |
Source: Public Records
Mortgage History
| Date | Status | Borrower | Loan Amount |
|---|---|---|---|
| Open | Shah Kavita D | $925,000 | |
| Previous Owner | 21 Tyler Road Llc | $1,295,000 |
Source: Public Records
Tax History Compared to Growth
Tax History
| Year | Tax Paid | Tax Assessment Tax Assessment Total Assessment is a certain percentage of the fair market value that is determined by local assessors to be the total taxable value of land and additions on the property. | Land | Improvement |
|---|---|---|---|---|
| 2025 | $39,405 | $3,222,000 | $1,152,000 | $2,070,000 |
| 2024 | $38,196 | $3,118,000 | $1,097,000 | $2,021,000 |
| 2023 | $30,277 | $2,329,000 | $998,000 | $1,331,000 |
| 2022 | $29,435 | $2,133,000 | $907,000 | $1,226,000 |
| 2021 | $29,946 | $2,081,000 | $864,000 | $1,217,000 |
| 2020 | $27,931 | $1,988,000 | $864,000 | $1,124,000 |
| 2019 | $27,266 | $1,931,000 | $823,000 | $1,108,000 |
| 2018 | $3,635 | $1,781,000 | $761,000 | $1,020,000 |
| 2017 | $25,546 | $1,763,000 | $725,000 | $1,038,000 |
| 2016 | $25,492 | $1,746,000 | $666,000 | $1,080,000 |
| 2015 | $24,281 | $1,634,000 | $605,000 | $1,029,000 |
| 2014 | $9,415 | $607,000 | $407,000 | $200,000 |
Source: Public Records
Map
Nearby Homes