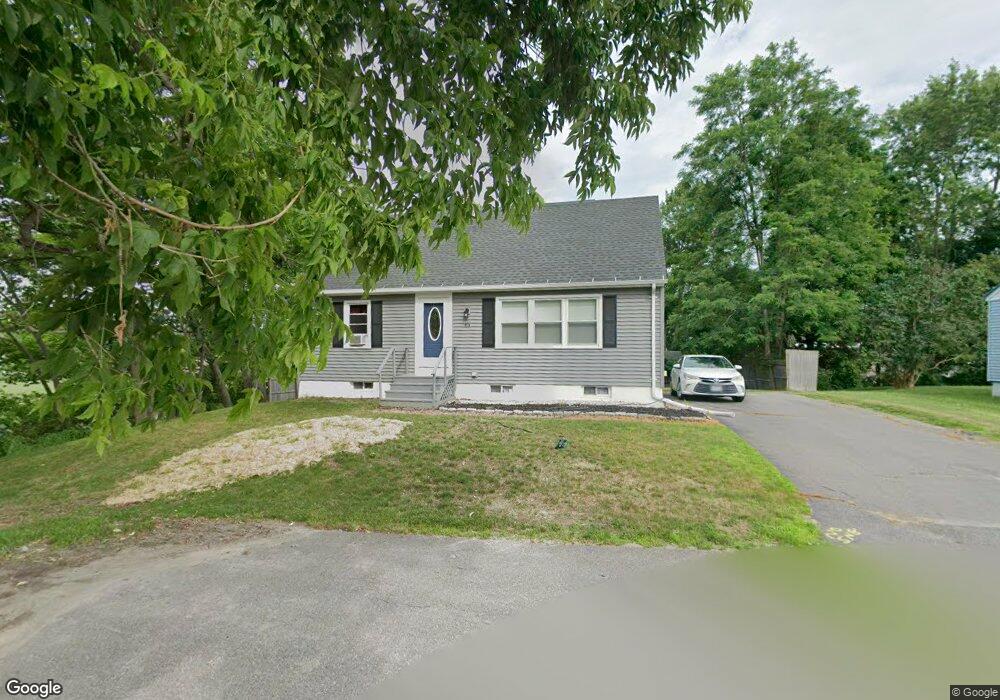
21 Vose St Waterville, ME 04901
Estimated Value: $263,000 - $284,000
3
Beds
2
Baths
1,382
Sq Ft
$195/Sq Ft
Est. Value
About This Home
This home is located at 21 Vose St, Waterville, ME 04901 and is currently estimated at $269,456, approximately $194 per square foot. 21 Vose St is a home located in Kennebec County with nearby schools including George J. Mitchell School, Albert S. Hall School, and Waterville Junior High School.
Ownership History
Date
Name
Owned For
Owner Type
Purchase Details
Closed on
Jun 8, 2019
Sold by
Bradstreet Julie A and Halliday Tracy J
Bought by
Bradstreet Julie A and Halliday Tracy J
Current Estimated Value
Purchase Details
Closed on
Apr 6, 2015
Sold by
Bradstreet Julie A
Bought by
Bradstreet Julie A and Halliday Tracy J
Purchase Details
Closed on
May 23, 2007
Sold by
Household Finance Corp 2
Bought by
Sanborn Corey and Sanborn Julie B
Purchase Details
Closed on
Apr 10, 2007
Sold by
Simonelli Richard J
Bought by
Household Finance Corp 2
Create a Home Valuation Report for This Property
The Home Valuation Report is an in-depth analysis detailing your home's value as well as a comparison with similar homes in the area
Home Values in the Area
Average Home Value in this Area
Purchase History
| Date | Buyer | Sale Price | Title Company |
|---|---|---|---|
| Bradstreet Julie A | -- | -- | |
| Bradstreet Julie A | -- | -- | |
| Sanborn Corey | -- | -- | |
| Household Finance Corp 2 | -- | -- |
Source: Public Records
Tax History Compared to Growth
Tax History
| Year | Tax Paid | Tax Assessment Tax Assessment Total Assessment is a certain percentage of the fair market value that is determined by local assessors to be the total taxable value of land and additions on the property. | Land | Improvement |
|---|---|---|---|---|
| 2025 | $3,970 | $233,500 | $25,400 | $208,100 |
| 2024 | $3,468 | $173,400 | $19,500 | $153,900 |
| 2023 | $3,451 | $173,400 | $19,500 | $153,900 |
| 2022 | $2,807 | $108,600 | $14,700 | $93,900 |
| 2021 | $2,769 | $108,600 | $14,700 | $93,900 |
| 2020 | $2,798 | $108,600 | $14,700 | $93,900 |
| 2019 | $2,798 | $108,600 | $14,700 | $93,900 |
| 2018 | $2,744 | $108,600 | $14,700 | $93,900 |
| 2017 | $2,534 | $108,600 | $14,700 | $93,900 |
| 2016 | $2,476 | $108,600 | $14,700 | $93,900 |
| 2015 | $2,013 | $72,400 | $16,900 | $55,500 |
| 2014 | $1,984 | $72,400 | $16,900 | $55,500 |
| 2013 | $1,984 | $72,400 | $16,900 | $55,500 |
Source: Public Records
Map
Nearby Homes