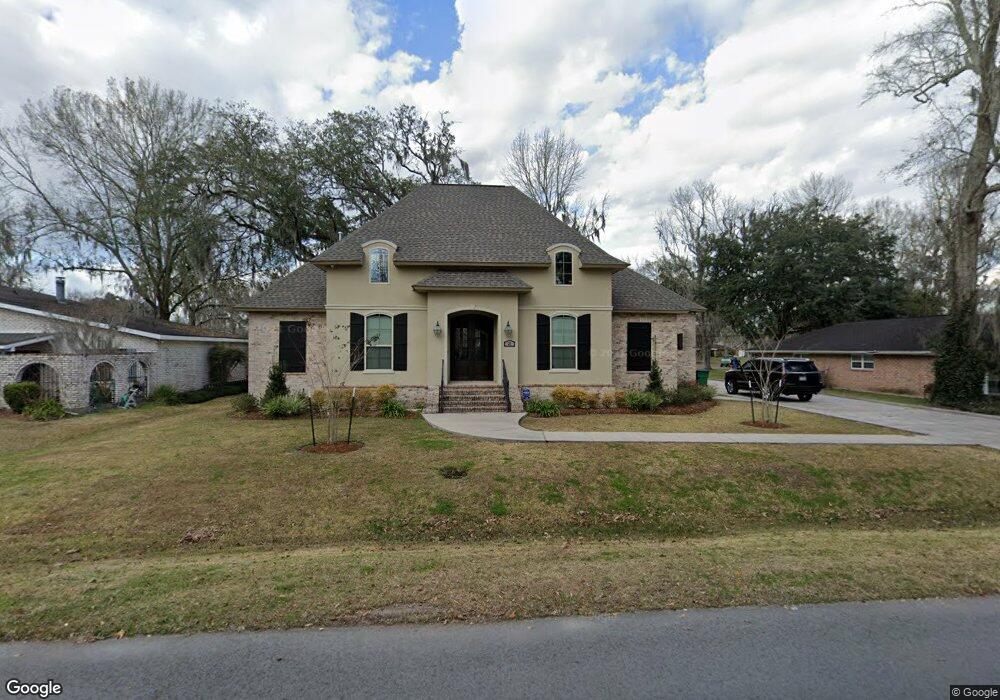
21 W Levert Dr Luling, LA 70070
Estimated Value: $382,000 - $496,000
Studio
--
Bath
3,261
Sq Ft
$138/Sq Ft
Est. Value
About This Home
This home is located at 21 W Levert Dr, Luling, LA 70070 and is currently estimated at $450,346, approximately $138 per square foot. 21 W Levert Dr is a home with nearby schools including Mimosa Park Elementary School, Lakewood Elementary School, and J.B. Martin Middle School.
Ownership History
Date
Name
Owned For
Owner Type
Purchase Details
Closed on
Nov 6, 2014
Sold by
Meyer Michele Duizend and Meyer Kevin Mark
Bought by
Vitrano Lindy Durham and Vitrano Gerard
Current Estimated Value
Purchase Details
Closed on
Sep 20, 2006
Sold by
Mediamolle Wayne L and Mediamolle Charlene Swetman
Bought by
Meyer Kevin Mark and Meyer Michele Duizend
Create a Home Valuation Report for This Property
The Home Valuation Report is an in-depth analysis detailing your home's value as well as a comparison with similar homes in the area
Home Values in the Area
Average Home Value in this Area
Purchase History
| Date | Buyer | Sale Price | Title Company |
|---|---|---|---|
| Vitrano Lindy Durham | $46,500 | Bromac Title Services Llc | |
| Meyer Kevin Mark | $85,000 | None Available |
Source: Public Records
Tax History
| Year | Tax Paid | Tax Assessment Tax Assessment Total Assessment is a certain percentage of the fair market value that is determined by local assessors to be the total taxable value of land and additions on the property. | Land | Improvement |
|---|---|---|---|---|
| 2025 | $3,609 | $43,210 | $9,320 | $33,890 |
| 2024 | $3,609 | $43,210 | $9,320 | $33,890 |
| 2023 | $3,665 | $36,200 | $5,920 | $30,280 |
| 2022 | $4,233 | $36,200 | $5,920 | $30,280 |
| 2021 | $3,521 | $29,855 | $5,328 | $24,527 |
| 2020 | $4,277 | $36,200 | $5,920 | $30,280 |
| 2019 | $4,293 | $36,200 | $4,700 | $31,500 |
| 2018 | $4,260 | $36,200 | $4,700 | $31,500 |
| 2017 | $4,255 | $36,200 | $4,700 | $31,500 |
| 2016 | $4,273 | $36,200 | $4,700 | $31,500 |
| 2015 | $467 | $3,975 | $3,975 | $0 |
| 2014 | $450 | $3,975 | $3,975 | $0 |
| 2013 | $452 | $3,975 | $3,975 | $0 |
Source: Public Records
Map
Nearby Homes
Your Personal Tour Guide
Ask me questions while you tour the home.