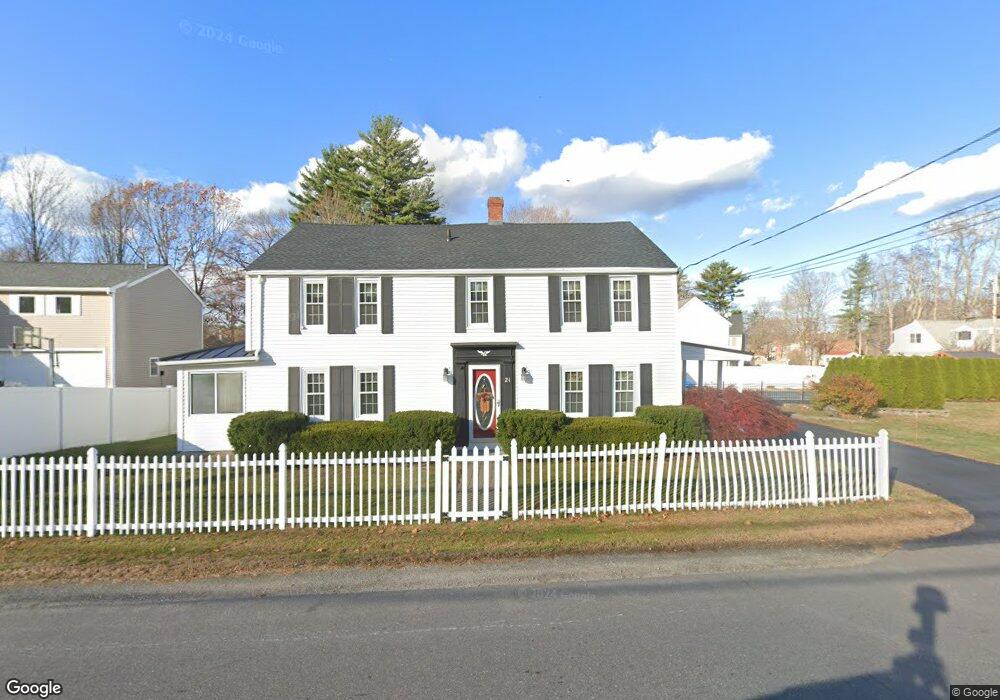
21 Walton Rd Seabrook, NH 03874
Estimated Value: $591,000 - $982,000
2
Beds
2
Baths
2,368
Sq Ft
$335/Sq Ft
Est. Value
About This Home
This home is located at 21 Walton Rd, Seabrook, NH 03874 and is currently estimated at $793,159, approximately $334 per square foot. 21 Walton Rd is a home located in Rockingham County with nearby schools including Seabrook Elementary School, Seabrook Middle School, and Winnacunnet High School.
Ownership History
Date
Name
Owned For
Owner Type
Purchase Details
Closed on
May 23, 2025
Sold by
Owens Alberto A and Owens Susan M
Bought by
Owens Ft and Owens
Current Estimated Value
Purchase Details
Closed on
Dec 16, 1999
Sold by
Climo John
Bought by
Felch Susan M
Home Financials for this Owner
Home Financials are based on the most recent Mortgage that was taken out on this home.
Original Mortgage
$118,800
Interest Rate
7.81%
Mortgage Type
Purchase Money Mortgage
Create a Home Valuation Report for This Property
The Home Valuation Report is an in-depth analysis detailing your home's value as well as a comparison with similar homes in the area
Home Values in the Area
Average Home Value in this Area
Purchase History
| Date | Buyer | Sale Price | Title Company |
|---|---|---|---|
| Owens Ft | -- | None Available | |
| Owens Ft | -- | None Available | |
| Felch Susan M | $132,000 | -- | |
| Felch Susan M | $132,000 | -- |
Source: Public Records
Mortgage History
| Date | Status | Borrower | Loan Amount |
|---|---|---|---|
| Previous Owner | Felch Susan M | $164,900 | |
| Previous Owner | Felch Susan M | $54,500 | |
| Previous Owner | Felch Susan M | $118,800 |
Source: Public Records
Tax History
| Year | Tax Paid | Tax Assessment Tax Assessment Total Assessment is a certain percentage of the fair market value that is determined by local assessors to be the total taxable value of land and additions on the property. | Land | Improvement |
|---|---|---|---|---|
| 2025 | $8,204 | $661,600 | $236,600 | $425,000 |
| 2024 | $7,754 | $661,600 | $236,600 | $425,000 |
| 2023 | $7,792 | $516,400 | $192,800 | $323,600 |
| 2022 | $6,842 | $516,400 | $192,800 | $323,600 |
| 2021 | $6,849 | $498,800 | $175,200 | $323,600 |
| 2020 | $6,607 | $413,700 | $140,300 | $273,400 |
| 2019 | $6,516 | $413,700 | $140,300 | $273,400 |
| 2018 | $6,531 | $401,900 | $128,500 | $273,400 |
| 2017 | $6,183 | $380,500 | $107,100 | $273,400 |
| 2016 | $5,628 | $380,500 | $107,100 | $273,400 |
| 2015 | $5,236 | $354,000 | $99,800 | $254,200 |
| 2014 | $5,406 | $354,000 | $99,800 | $254,200 |
| 2013 | $5,406 | $354,000 | $99,800 | $254,200 |
Source: Public Records
Map
Nearby Homes
- 6 Forest Dr
- 14 Ayer Cir
- 117 Whip-Poor-will St
- 104 Whippoorwill St
- 176 Lower Collins St
- 188 Lafayette Rd
- 46 Farm Ln
- 86 Brown Ave
- 71 Cynthia Cir
- 9 Kimberly Dr Unit 9
- 47 Scott Ave
- 19 Viola Cir
- 101 Lillian Ave
- 7 Toll Rd
- 217 S Main St
- 64 Seabrook Rd
- 44 Seabrook Rd
- 11 A St
- 308 Route 286 Unit Lot 58
- 2 True Rd
Your Personal Tour Guide
Ask me questions while you tour the home.