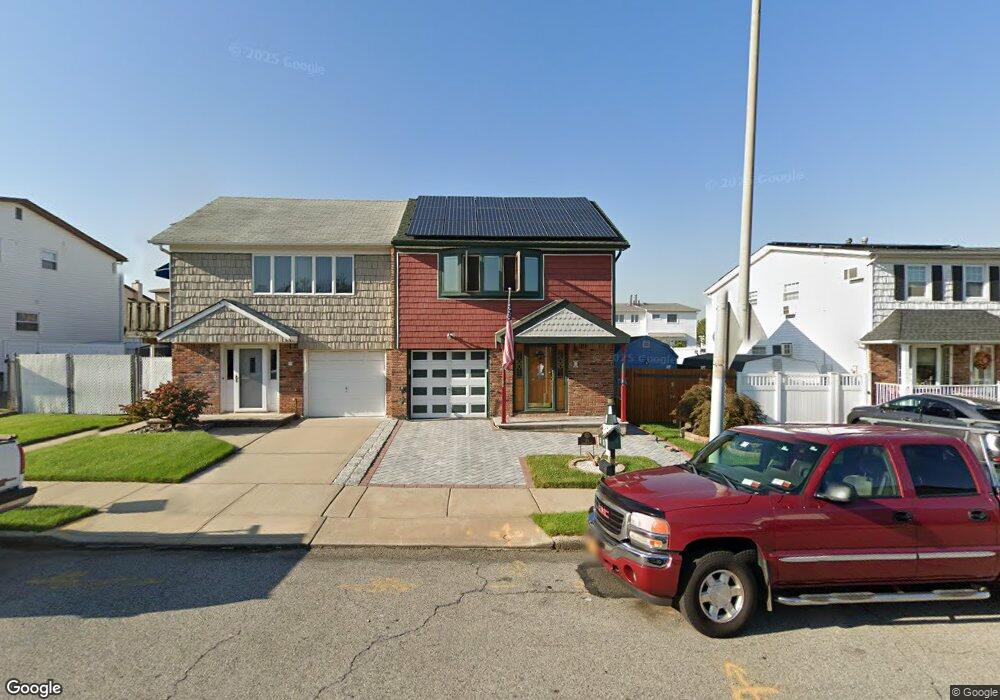
21 Watkins Ave Staten Island, NY 10312
Arden Heights NeighborhoodEstimated Value: $828,827 - $881,000
4
Beds
3
Baths
2,088
Sq Ft
$410/Sq Ft
Est. Value
About This Home
This home is located at 21 Watkins Ave, Staten Island, NY 10312 and is currently estimated at $856,457, approximately $410 per square foot. 21 Watkins Ave is a home located in Richmond County with nearby schools including P.S. 42 The Eltingville School, I.S. 075 Frank D. Paulo, and Tottenville High School.
Ownership History
Date
Name
Owned For
Owner Type
Purchase Details
Closed on
Nov 13, 2019
Sold by
Garcia Ricardo and Garcia Sari
Bought by
Garcia Ricardo and Garcia Sari
Current Estimated Value
Purchase Details
Closed on
Aug 24, 1999
Sold by
Rokhsar Anoushiraven
Bought by
Chiu Kwong K and Lam Yuen Yee
Home Financials for this Owner
Home Financials are based on the most recent Mortgage that was taken out on this home.
Original Mortgage
$190,000
Interest Rate
7.86%
Purchase Details
Closed on
Jul 30, 1999
Sold by
Chiu Kwong K and Lam Yuen Yee
Bought by
Garcia Ricardo and Garcia Sari
Home Financials for this Owner
Home Financials are based on the most recent Mortgage that was taken out on this home.
Original Mortgage
$190,000
Interest Rate
7.86%
Create a Home Valuation Report for This Property
The Home Valuation Report is an in-depth analysis detailing your home's value as well as a comparison with similar homes in the area
Home Values in the Area
Average Home Value in this Area
Purchase History
| Date | Buyer | Sale Price | Title Company |
|---|---|---|---|
| Garcia Ricardo | -- | Alr Abstract Services Llc | |
| Chiu Kwong K | $330,000 | First American Title Ins Co | |
| Garcia Ricardo | $240,000 | Chicago Title Insurance Co |
Source: Public Records
Mortgage History
| Date | Status | Borrower | Loan Amount |
|---|---|---|---|
| Previous Owner | Garcia Ricardo | $190,000 |
Source: Public Records
Tax History Compared to Growth
Tax History
| Year | Tax Paid | Tax Assessment Tax Assessment Total Assessment is a certain percentage of the fair market value that is determined by local assessors to be the total taxable value of land and additions on the property. | Land | Improvement |
|---|---|---|---|---|
| 2025 | $7,275 | $49,320 | $7,268 | $42,052 |
| 2024 | $7,287 | $44,940 | $7,735 | $37,205 |
| 2023 | $7,138 | $36,547 | $7,524 | $29,023 |
| 2022 | $6,957 | $41,280 | $9,240 | $32,040 |
| 2021 | $6,908 | $40,020 | $9,240 | $30,780 |
| 2020 | $6,547 | $37,620 | $9,240 | $28,380 |
| 2019 | $6,265 | $38,520 | $9,240 | $29,280 |
| 2018 | $5,911 | $30,456 | $8,017 | $22,439 |
| 2017 | $5,865 | $30,240 | $9,096 | $21,144 |
| 2016 | $5,399 | $28,556 | $8,778 | $19,778 |
| 2015 | $4,709 | $26,940 | $7,680 | $19,260 |
| 2014 | $4,709 | $26,126 | $7,652 | $18,474 |
Source: Public Records
Map
Nearby Homes