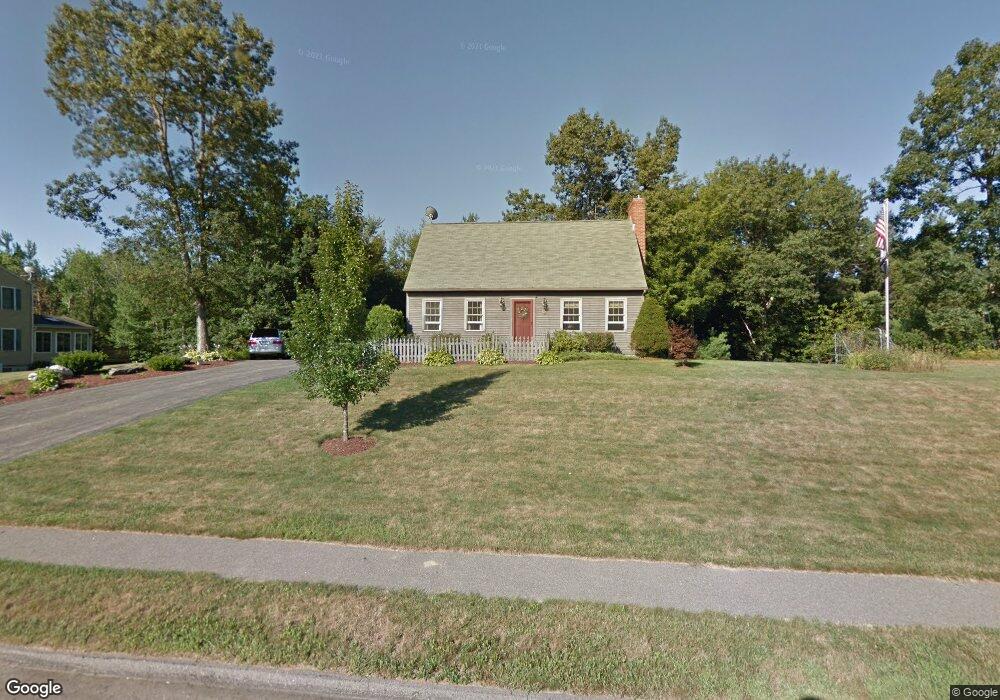
21 Watson Ln Rutland, MA 01543
Estimated Value: $520,000 - $574,000
2
Beds
2
Baths
1,555
Sq Ft
$349/Sq Ft
Est. Value
About This Home
This home is located at 21 Watson Ln, Rutland, MA 01543 and is currently estimated at $543,264, approximately $349 per square foot. 21 Watson Ln is a home located in Worcester County with nearby schools including Wachusett Regional High School.
Ownership History
Date
Name
Owned For
Owner Type
Purchase Details
Closed on
May 1, 2002
Sold by
Marsden Joan M and Marsden Jeffrey J
Bought by
Berthiaume Christopher and Berthiaume Jennifer L
Current Estimated Value
Purchase Details
Closed on
Feb 27, 1998
Sold by
Penny&Hyland Invest Pr and Penny Richard H
Bought by
Marsden Jeffrey J and Marsden Joan M
Purchase Details
Closed on
Nov 14, 1997
Sold by
Gauthier Leo Robert
Bought by
Penny&Hyland Invest
Purchase Details
Closed on
Oct 9, 1992
Sold by
Gengel C & S Bldrs
Bought by
Gauthier Leo R and Gauthier Robin
Create a Home Valuation Report for This Property
The Home Valuation Report is an in-depth analysis detailing your home's value as well as a comparison with similar homes in the area
Home Values in the Area
Average Home Value in this Area
Purchase History
| Date | Buyer | Sale Price | Title Company |
|---|---|---|---|
| Berthiaume Christopher | $225,000 | -- | |
| Marsden Jeffrey J | $139,000 | -- | |
| Penny&Hyland Invest | $117,000 | -- | |
| Gauthier Leo R | $146,800 | -- |
Source: Public Records
Mortgage History
| Date | Status | Borrower | Loan Amount |
|---|---|---|---|
| Open | Gauthier Leo R | $200,000 | |
| Closed | Gauthier Leo R | $23,000 |
Source: Public Records
Tax History Compared to Growth
Tax History
| Year | Tax Paid | Tax Assessment Tax Assessment Total Assessment is a certain percentage of the fair market value that is determined by local assessors to be the total taxable value of land and additions on the property. | Land | Improvement |
|---|---|---|---|---|
| 2025 | $6,088 | $427,500 | $129,000 | $298,500 |
| 2024 | $5,612 | $378,400 | $119,800 | $258,600 |
| 2023 | $5,167 | $376,600 | $113,200 | $263,400 |
| 2022 | $5,125 | $324,600 | $94,000 | $230,600 |
| 2021 | $5,122 | $306,700 | $102,000 | $204,700 |
| 2020 | $5,206 | $295,600 | $91,300 | $204,300 |
| 2019 | $5,100 | $285,100 | $78,900 | $206,200 |
| 2018 | $5,026 | $277,200 | $78,900 | $198,300 |
| 2017 | $4,677 | $255,300 | $78,900 | $176,400 |
| 2016 | $3,886 | $223,700 | $77,800 | $145,900 |
| 2015 | $3,648 | $206,700 | $77,800 | $128,900 |
| 2014 | $3,537 | $206,700 | $77,800 | $128,900 |
Source: Public Records
Map
Nearby Homes
- 25 Watson Ln
- 55 Pommogussett Rd
- 32 Pommogussett Rd Unit 1
- 5 Miles Rd
- 16 Richards Ave
- 28 Forest Hill Dr
- 11 Lewis St
- 21 Lewis St
- 27 Lewis St
- 12 Lewis St
- 6 Lewis St
- 10 Soucy Dr
- 2 Forest Hill Dr
- 21 Highland Park Rd
- 85 Maple Ave Unit A
- 40 Brunelle Dr
- 101 Brintnal Dr
- 73 Brintnal Dr
- 132 Fidelity Dr Unit 61
- 10 Fidelity Dr Unit 5