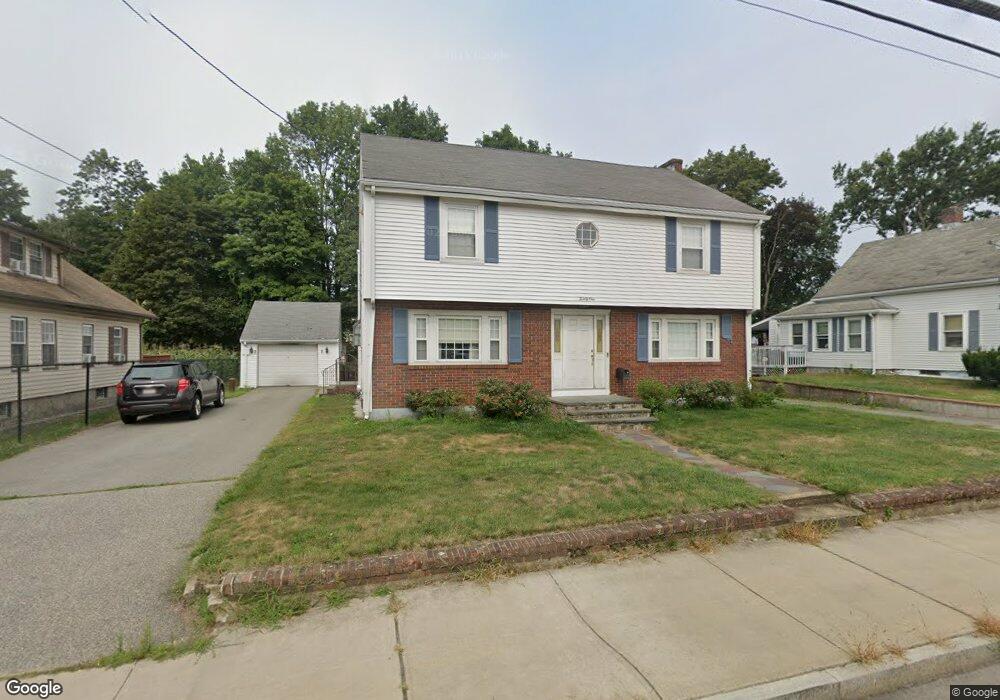
21 West St Brockton, MA 02301
Winters Corner NeighborhoodEstimated Value: $598,526 - $694,000
3
Beds
2
Baths
2,483
Sq Ft
$259/Sq Ft
Est. Value
About This Home
This home is located at 21 West St, Brockton, MA 02301 and is currently estimated at $643,132, approximately $259 per square foot. 21 West St is a home located in Plymouth County with nearby schools including Manthala George Jr. School, Hancock Elementary School, and Louis F Angelo Elementary School.
Ownership History
Date
Name
Owned For
Owner Type
Purchase Details
Closed on
Dec 28, 2004
Sold by
Yiotopoulos George and Vardaxis Konstantina
Bought by
Williams Edward M
Current Estimated Value
Home Financials for this Owner
Home Financials are based on the most recent Mortgage that was taken out on this home.
Original Mortgage
$192,000
Outstanding Balance
$96,874
Interest Rate
5.74%
Mortgage Type
Purchase Money Mortgage
Estimated Equity
$546,258
Create a Home Valuation Report for This Property
The Home Valuation Report is an in-depth analysis detailing your home's value as well as a comparison with similar homes in the area
Home Values in the Area
Average Home Value in this Area
Purchase History
| Date | Buyer | Sale Price | Title Company |
|---|---|---|---|
| Williams Edward M | $240,000 | -- |
Source: Public Records
Mortgage History
| Date | Status | Borrower | Loan Amount |
|---|---|---|---|
| Open | Williams Edward M | $192,000 | |
| Closed | Williams Edward M | $48,000 |
Source: Public Records
Tax History Compared to Growth
Tax History
| Year | Tax Paid | Tax Assessment Tax Assessment Total Assessment is a certain percentage of the fair market value that is determined by local assessors to be the total taxable value of land and additions on the property. | Land | Improvement |
|---|---|---|---|---|
| 2025 | $6,337 | $523,300 | $144,500 | $378,800 |
| 2024 | $5,967 | $496,400 | $144,500 | $351,900 |
| 2023 | $5,722 | $440,800 | $109,400 | $331,400 |
| 2022 | $5,392 | $386,000 | $99,400 | $286,600 |
| 2021 | $4,998 | $344,700 | $93,200 | $251,500 |
| 2020 | $9,655 | $341,900 | $89,400 | $252,500 |
| 2019 | $5,096 | $327,900 | $83,400 | $244,500 |
| 2018 | $4,950 | $281,300 | $83,400 | $197,900 |
| 2017 | $4,434 | $275,400 | $83,400 | $192,000 |
| 2016 | $4,430 | $255,200 | $79,500 | $175,700 |
| 2015 | $4,144 | $228,300 | $79,500 | $148,800 |
| 2014 | $4,052 | $223,500 | $79,500 | $144,000 |
Source: Public Records
Map
Nearby Homes
- 37 West St
- 25 Monson St
- 28 Fern Ave
- 20 Montauk Rd
- 21 Oneida Ave
- 17 Moraine Place
- 48 N Belcher Ave
- 67 Sycamore Ave Unit 3
- 77 Colonel Bell Dr Unit 4
- 161 Moraine St
- 72 W Elm Terrace
- 78 Keene St
- 61 Fairfield St
- 114 Crickett Rd
- 141 Prospect Ave
- 45 Briarcliff Rd
- 281 Spring St
- 175 Belmont Ave
- 45 Cross St
- 190 Highland St