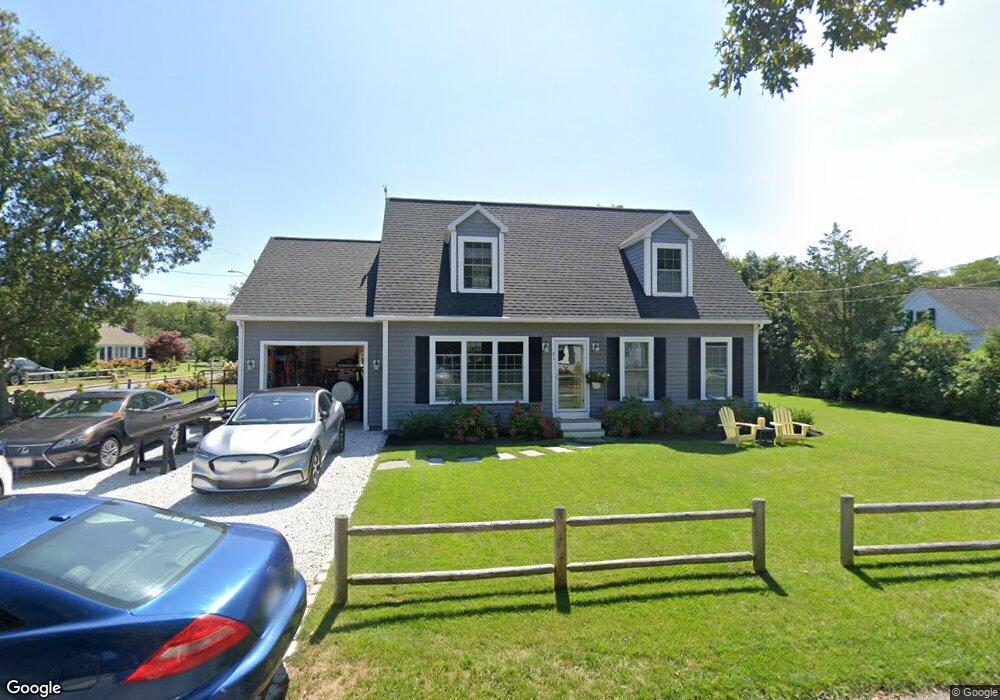
21 West St Dennis Port, MA 02639
Dennis Port NeighborhoodEstimated Value: $902,000 - $1,369,144
3
Beds
3
Baths
1,865
Sq Ft
$614/Sq Ft
Est. Value
About This Home
This home is located at 21 West St, Dennis Port, MA 02639 and is currently estimated at $1,145,286, approximately $614 per square foot. 21 West St is a home located in Barnstable County with nearby schools including Dennis-Yarmouth Regional High School and St. Pius X. School.
Ownership History
Date
Name
Owned For
Owner Type
Purchase Details
Closed on
Mar 31, 2025
Sold by
Dwyer Gerardine E and Dwyer Mark A
Bought by
Mark Andrew Dwyer T and Mark Dwyer
Current Estimated Value
Purchase Details
Closed on
Sep 30, 2014
Sold by
Dwyer Mark A
Bought by
Dwyer Mark A and Dwyer Gerardine E
Purchase Details
Closed on
Mar 20, 1992
Sold by
Galbreath John W and Galbreath Eleanor A
Bought by
Dwyer Mark A
Home Financials for this Owner
Home Financials are based on the most recent Mortgage that was taken out on this home.
Original Mortgage
$76,000
Interest Rate
8.62%
Mortgage Type
Purchase Money Mortgage
Create a Home Valuation Report for This Property
The Home Valuation Report is an in-depth analysis detailing your home's value as well as a comparison with similar homes in the area
Home Values in the Area
Average Home Value in this Area
Purchase History
| Date | Buyer | Sale Price | Title Company |
|---|---|---|---|
| Mark Andrew Dwyer T | -- | None Available | |
| Mark Andrew Dwyer T | -- | None Available | |
| Dwyer Mark A | -- | -- | |
| Dwyer Mark A | -- | -- | |
| Dwyer Mark A | $95,000 | -- | |
| Dwyer Mark A | $95,000 | -- |
Source: Public Records
Mortgage History
| Date | Status | Borrower | Loan Amount |
|---|---|---|---|
| Previous Owner | Dwyer Mark A | $76,000 | |
| Previous Owner | Dwyer Mark A | $76,000 |
Source: Public Records
Tax History Compared to Growth
Tax History
| Year | Tax Paid | Tax Assessment Tax Assessment Total Assessment is a certain percentage of the fair market value that is determined by local assessors to be the total taxable value of land and additions on the property. | Land | Improvement |
|---|---|---|---|---|
| 2025 | $5,283 | $1,220,000 | $309,500 | $910,500 |
| 2024 | $5,189 | $1,182,000 | $297,600 | $884,400 |
| 2023 | $5,019 | $1,074,800 | $270,500 | $804,300 |
| 2022 | $1,259 | $224,900 | $213,300 | $11,600 |
| 2021 | $3,157 | $331,900 | $209,100 | $122,800 |
| 2020 | $3,369 | $325,100 | $209,100 | $116,000 |
| 2019 | $2,013 | $326,200 | $222,500 | $103,700 |
| 2018 | $2,888 | $312,400 | $213,000 | $99,400 |
| 2017 | $1,818 | $295,600 | $196,200 | $99,400 |
| 2016 | $1,755 | $268,700 | $185,000 | $83,700 |
| 2015 | $1,720 | $268,700 | $185,000 | $83,700 |
| 2014 | $1,619 | $255,000 | $173,800 | $81,200 |
Source: Public Records
Map
Nearby Homes
- 402 Old Wharf Rd
- 102 Sea St
- 402 Old Wharf Rd
- 11 Ocean Park W
- 405 Old Wharf Rd Unit B204
- 405 Old Wharf Rd Unit B204
- 9 Chase Ave Unit 6
- 26 Manning Rd
- 22 Ferncliff Rd
- 12 Cross St
- 159 Center St Unit 22
- 37-A Beach Hills Rd
- 1 E Belmont Unit 630
- 37 Beach Hills Rd
- 1 Belmont Rd Unit 630
- 1 Belmont Rd Unit 513
- 262 Old Wharf Rd Unit 67
- 262 Old Wharf Rd Unit 5
- 262 Old Wharf Rd Unit 5
- 262 Old Wharf Rd Unit 20