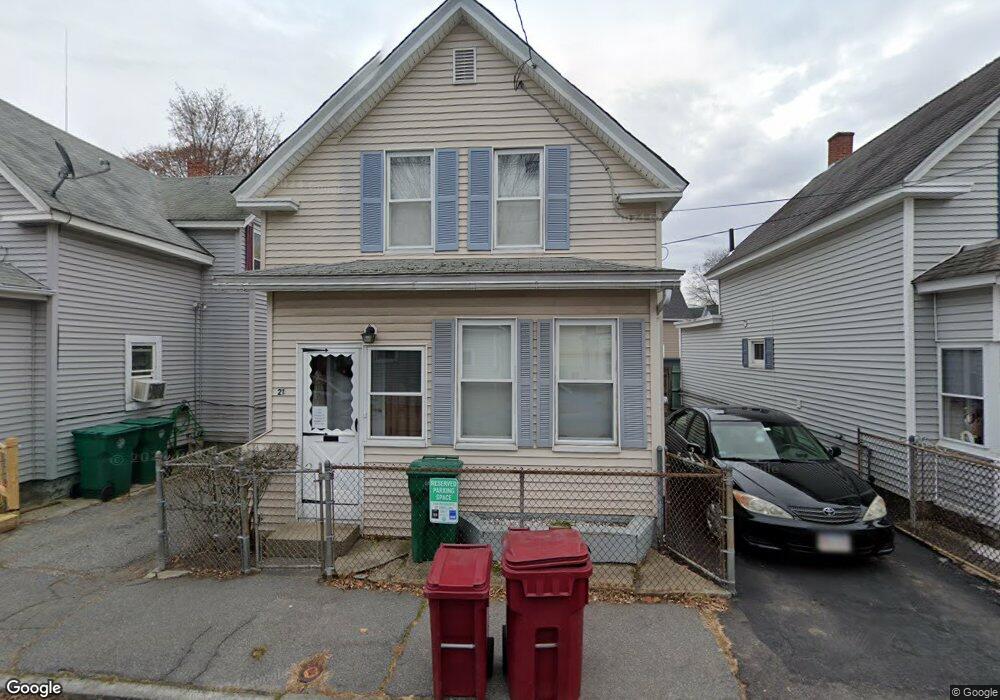
21 West St Lowell, MA 01850
Centralville NeighborhoodEstimated Value: $366,000 - $424,000
2
Beds
1
Bath
1,351
Sq Ft
$289/Sq Ft
Est. Value
About This Home
This home is located at 21 West St, Lowell, MA 01850 and is currently estimated at $390,103, approximately $288 per square foot. 21 West St is a home located in Middlesex County with nearby schools including Greenhalge Elementary School, S. Christa McAuliffe Elementary School, and Moody Elementary School.
Ownership History
Date
Name
Owned For
Owner Type
Purchase Details
Closed on
Jun 19, 2024
Sold by
Eno Paul G
Bought by
Paul G Eno Irt and Fadden
Current Estimated Value
Purchase Details
Closed on
Mar 26, 2021
Sold by
Eno Rita G and Eno Paul G
Bought by
Eno Paul G
Purchase Details
Closed on
Oct 24, 2006
Sold by
Eno Rita G and Gaillardetz Rita G
Bought by
Eno Paul G and Eno Rita G
Create a Home Valuation Report for This Property
The Home Valuation Report is an in-depth analysis detailing your home's value as well as a comparison with similar homes in the area
Home Values in the Area
Average Home Value in this Area
Purchase History
| Date | Buyer | Sale Price | Title Company |
|---|---|---|---|
| Paul G Eno Irt | -- | None Available | |
| Paul G Eno Irt | -- | None Available | |
| Eno Paul G | -- | None Available | |
| Eno Paul G | -- | None Available | |
| Eno Paul G | -- | -- | |
| Eno Paul G | -- | -- |
Source: Public Records
Tax History
| Year | Tax Paid | Tax Assessment Tax Assessment Total Assessment is a certain percentage of the fair market value that is determined by local assessors to be the total taxable value of land and additions on the property. | Land | Improvement |
|---|---|---|---|---|
| 2025 | $3,652 | $318,100 | $105,400 | $212,700 |
| 2024 | $3,430 | $288,000 | $87,600 | $200,400 |
| 2023 | $3,237 | $260,600 | $76,200 | $184,400 |
| 2022 | $2,854 | $224,900 | $60,600 | $164,300 |
| 2021 | $2,664 | $197,900 | $52,700 | $145,200 |
| 2020 | $2,546 | $190,600 | $52,700 | $137,900 |
| 2019 | $2,276 | $162,100 | $45,300 | $116,800 |
| 2018 | $2,225 | $154,600 | $43,100 | $111,500 |
| 2017 | $2,116 | $141,800 | $36,200 | $105,600 |
| 2016 | $2,039 | $134,500 | $37,900 | $96,600 |
| 2015 | $1,989 | $128,500 | $39,100 | $89,400 |
| 2013 | $1,899 | $126,500 | $47,000 | $79,500 |
Source: Public Records
Map
Nearby Homes
- 118 W 6th St
- 27 Bunker Hill Ave
- 45 W 4th St
- 272 W 6th St
- 52 Lawrence Dr Unit 206
- 130 John St Unit G45
- 130 John St Unit 350
- 130 John St Unit G01
- 130 John St Unit 242
- 130 John St Unit 250
- 27-29 Fifth St
- 25 Read St
- 106 Methuen St Unit B
- 94 1st St Unit 10
- 18 May St
- 15 Dana St
- 105 3rd St
- 10 Kearney Square Unit 407
- 9 Central St Unit 601
- 9 Central St Unit 602
Your Personal Tour Guide
Ask me questions while you tour the home.