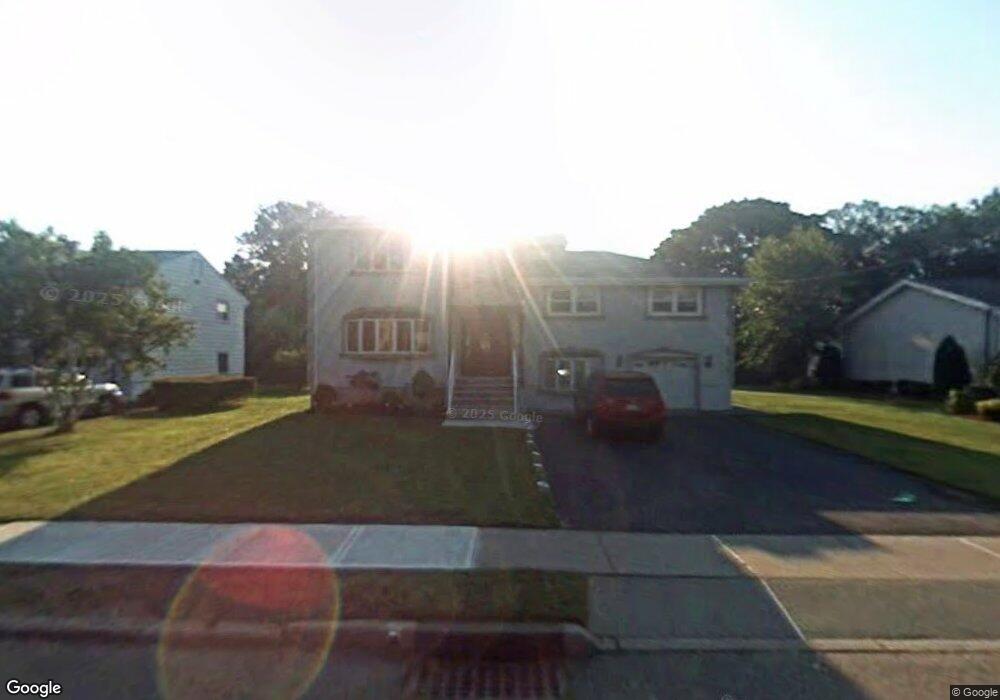
21 Wester Place Clifton, NJ 07013
Montclair Heights NeighborhoodEstimated Value: $862,595 - $948,000
Studio
--
Bath
3,068
Sq Ft
$295/Sq Ft
Est. Value
About This Home
This home is located at 21 Wester Place, Clifton, NJ 07013 and is currently estimated at $905,149, approximately $295 per square foot. 21 Wester Place is a home located in Passaic County with nearby schools including Clifton High School, St Andrew Elementary School, and St Thomas The Apostle School.
Ownership History
Date
Name
Owned For
Owner Type
Purchase Details
Closed on
Mar 30, 2005
Sold by
Trent Fred E
Bought by
Naik Jaydeep M
Current Estimated Value
Home Financials for this Owner
Home Financials are based on the most recent Mortgage that was taken out on this home.
Original Mortgage
$359,000
Interest Rate
5.2%
Mortgage Type
New Conventional
Create a Home Valuation Report for This Property
The Home Valuation Report is an in-depth analysis detailing your home's value as well as a comparison with similar homes in the area
Home Values in the Area
Average Home Value in this Area
Purchase History
| Date | Buyer | Sale Price | Title Company |
|---|---|---|---|
| Naik Jaydeep M | $460,000 | -- |
Source: Public Records
Mortgage History
| Date | Status | Borrower | Loan Amount |
|---|---|---|---|
| Closed | Naik Jaydeep M | $359,000 |
Source: Public Records
Tax History
| Year | Tax Paid | Tax Assessment Tax Assessment Total Assessment is a certain percentage of the fair market value that is determined by local assessors to be the total taxable value of land and additions on the property. | Land | Improvement |
|---|---|---|---|---|
| 2025 | $18,776 | $316,300 | $132,300 | $184,000 |
| 2024 | $18,326 | $316,300 | $132,300 | $184,000 |
Source: Public Records
Map
Nearby Homes
- 70 Anderson Dr
- 169 Haddenfield Rd
- 34 Carline Dr
- 24 Malcolm Ct
- 77 Macarthur Dr
- 18 Roy Ct
- 33 Tuers Place
- 605 Grove St Unit 11
- 605 Grove St Unit 8
- 605 Grove St Unit 16
- 117 Yantacaw Brook Rd
- 34 Chanda Ct
- 34 Chanda Ct Unit D034
- 35 Chanda Ct Unit D035
- 35 Chanda Ct
- 37 Chanda Ct
- 37 Chanda Ct Unit D037
- 565 Grove St Unit B12
- 11 Kenneth Rd
- 118 Country Ln
Your Personal Tour Guide
Ask me questions while you tour the home.