21 Westover Rd Troy, NY 12180
Eastside Troy NeighborhoodEstimated Value: $547,000 - $664,854
7
Beds
5
Baths
4,800
Sq Ft
$130/Sq Ft
Est. Value
About This Home
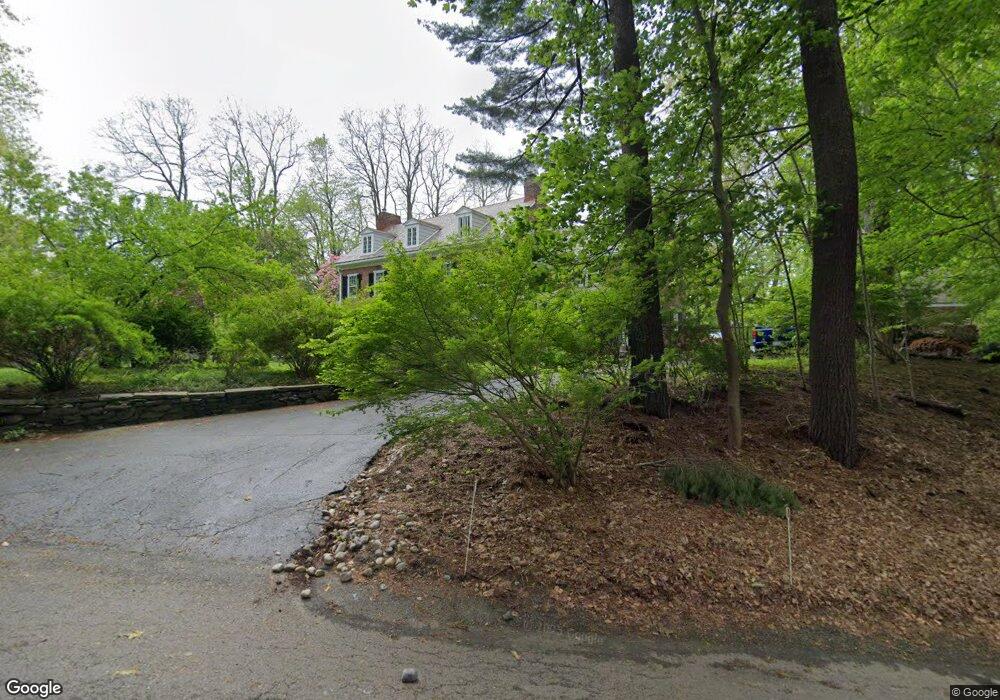
This home is located at 21 Westover Rd, Troy, NY 12180 and is currently estimated at $624,964, approximately $130 per square foot. 21 Westover Rd is a home located in Rensselaer County with nearby schools including P.S. 16, Troy Middle School, and Troy High School.
Ownership History
Date
Name
Owned For
Owner Type
Purchase Details
Closed on
Nov 1, 2014
Sold by
Briccetti Jon
Bought by
Briccetti Jon and Jamison
Current Estimated Value
Purchase Details
Closed on
Jun 22, 2009
Sold by
Obrien Thomas
Bought by
Briccetti Jon
Home Financials for this Owner
Home Financials are based on the most recent Mortgage that was taken out on this home.
Original Mortgage
$508,500
Outstanding Balance
$318,326
Interest Rate
4.92%
Mortgage Type
Purchase Money Mortgage
Estimated Equity
$306,638
Create a Home Valuation Report for This Property
The Home Valuation Report is an in-depth analysis detailing your home's value as well as a comparison with similar homes in the area
Home Values in the Area
Average Home Value in this Area
Purchase History
| Date | Buyer | Sale Price | Title Company |
|---|---|---|---|
| Briccetti Jon | -- | Karen Valle | |
| Briccetti Jon | $565,000 | Marcia Doyle Stallmer Marcia |
Source: Public Records
Mortgage History
| Date | Status | Borrower | Loan Amount |
|---|---|---|---|
| Open | Briccetti Jon | $508,500 |
Source: Public Records
Tax History
| Year | Tax Paid | Tax Assessment Tax Assessment Total Assessment is a certain percentage of the fair market value that is determined by local assessors to be the total taxable value of land and additions on the property. | Land | Improvement |
|---|---|---|---|---|
| 2024 | $19,245 | $410,000 | $46,100 | $363,900 |
| 2023 | $18,932 | $410,000 | $46,100 | $363,900 |
| 2022 | $18,575 | $410,000 | $46,100 | $363,900 |
| 2021 | $4,669 | $410,000 | $46,100 | $363,900 |
| 2020 | $9,442 | $410,000 | $46,100 | $363,900 |
| 2019 | $13,410 | $410,000 | $46,100 | $363,900 |
| 2018 | $13,410 | $410,000 | $46,100 | $363,900 |
| 2017 | $13,349 | $410,000 | $46,100 | $363,900 |
| 2016 | $17,645 | $410,000 | $46,100 | $363,900 |
| 2015 | -- | $410,000 | $46,100 | $363,900 |
| 2014 | -- | $410,000 | $46,100 | $363,900 |
Source: Public Records
Map
Nearby Homes
Your Personal Tour Guide
Ask me questions while you tour the home.