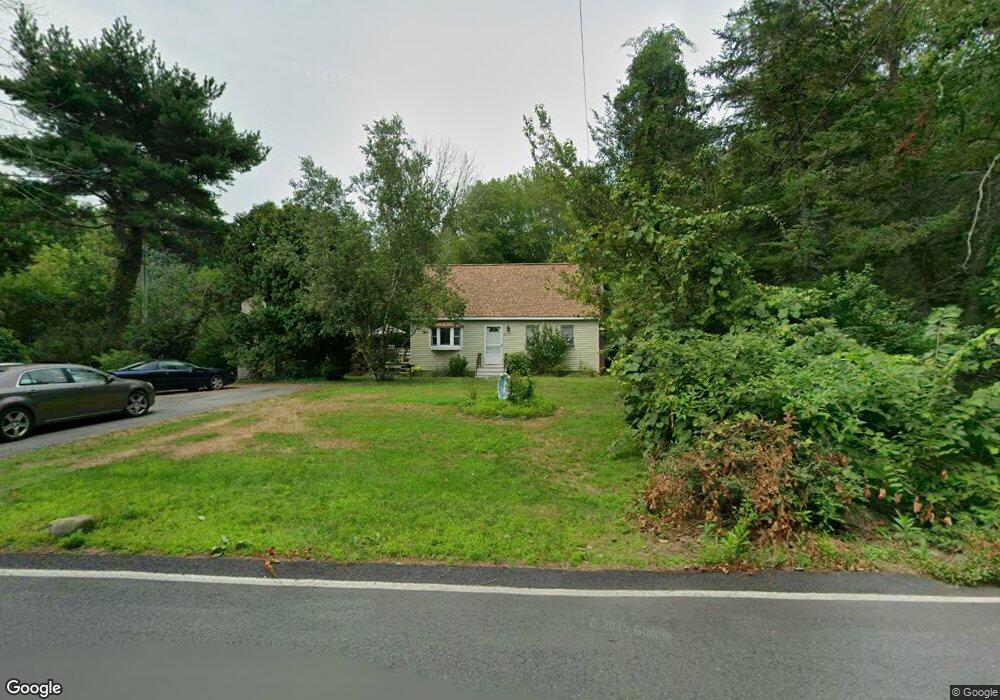
21 Williams St Mansfield, MA 02048
Estimated Value: $555,000 - $744,000
2
Beds
2
Baths
1,421
Sq Ft
$435/Sq Ft
Est. Value
About This Home
This home is located at 21 Williams St, Mansfield, MA 02048 and is currently estimated at $617,819, approximately $434 per square foot. 21 Williams St is a home located in Bristol County with nearby schools including Everett W. Robinson Elementary School, Jordan/Jackson Elementary School, and Harold L. Qualters Middle School.
Ownership History
Date
Name
Owned For
Owner Type
Purchase Details
Closed on
Sep 6, 1991
Sold by
A S Resolution T
Bought by
Howard Charles W and Howard Darlene
Current Estimated Value
Home Financials for this Owner
Home Financials are based on the most recent Mortgage that was taken out on this home.
Original Mortgage
$86,000
Interest Rate
9.43%
Mortgage Type
Purchase Money Mortgage
Purchase Details
Closed on
Sep 26, 1990
Sold by
Pigeon Gerard A
Bought by
Decosta Keith
Home Financials for this Owner
Home Financials are based on the most recent Mortgage that was taken out on this home.
Original Mortgage
$67,400
Interest Rate
9.95%
Mortgage Type
Purchase Money Mortgage
Purchase Details
Closed on
Dec 1, 1989
Sold by
Gill Johnna
Bought by
Wood Eric
Create a Home Valuation Report for This Property
The Home Valuation Report is an in-depth analysis detailing your home's value as well as a comparison with similar homes in the area
Home Values in the Area
Average Home Value in this Area
Purchase History
| Date | Buyer | Sale Price | Title Company |
|---|---|---|---|
| Howard Charles W | $107,500 | -- | |
| Decosta Keith | $71,000 | -- | |
| Wood Eric | $38,154 | -- |
Source: Public Records
Mortgage History
| Date | Status | Borrower | Loan Amount |
|---|---|---|---|
| Open | Wood Eric | $81,900 | |
| Closed | Wood Eric | $90,000 | |
| Closed | Wood Eric | $86,000 | |
| Previous Owner | Wood Eric | $67,400 |
Source: Public Records
Tax History Compared to Growth
Tax History
| Year | Tax Paid | Tax Assessment Tax Assessment Total Assessment is a certain percentage of the fair market value that is determined by local assessors to be the total taxable value of land and additions on the property. | Land | Improvement |
|---|---|---|---|---|
| 2025 | $6,311 | $479,200 | $249,300 | $229,900 |
| 2024 | $6,518 | $482,800 | $249,300 | $233,500 |
| 2023 | $6,491 | $460,700 | $249,300 | $211,400 |
| 2022 | $6,279 | $413,900 | $230,800 | $183,100 |
| 2021 | $4,688 | $382,400 | $202,000 | $180,400 |
| 2020 | $6,051 | $359,100 | $192,300 | $166,800 |
| 2019 | $5,000 | $328,500 | $160,200 | $168,300 |
| 2018 | $4,931 | $316,700 | $152,900 | $163,800 |
| 2017 | $4,464 | $297,200 | $148,600 | $148,600 |
| 2016 | $4,028 | $261,400 | $141,300 | $120,100 |
| 2015 | $4,010 | $258,700 | $141,300 | $117,400 |
Source: Public Records
Map
Nearby Homes
- 4 Buckskin Dr
- 150 Gilbert St
- 176 Elm St
- 24 Maverick Dr
- 2 Oak St Unit 2D
- 2 Oak St Unit 2A
- 2 Oak St Unit 2C
- 2 Oak St Unit 2B
- 450 West St
- 231 Spring St
- 255 Mckeon Dr
- 451R Gilbert St
- 37 Oakleaf Dr
- 166 Chauncy St
- 406 South St
- 16 East St Unit 2
- 250 Mansfield Ave Unit 66
- 196 Donald Tennant Cir
- 28 Court St
- 15 Reservoir St Unit 44