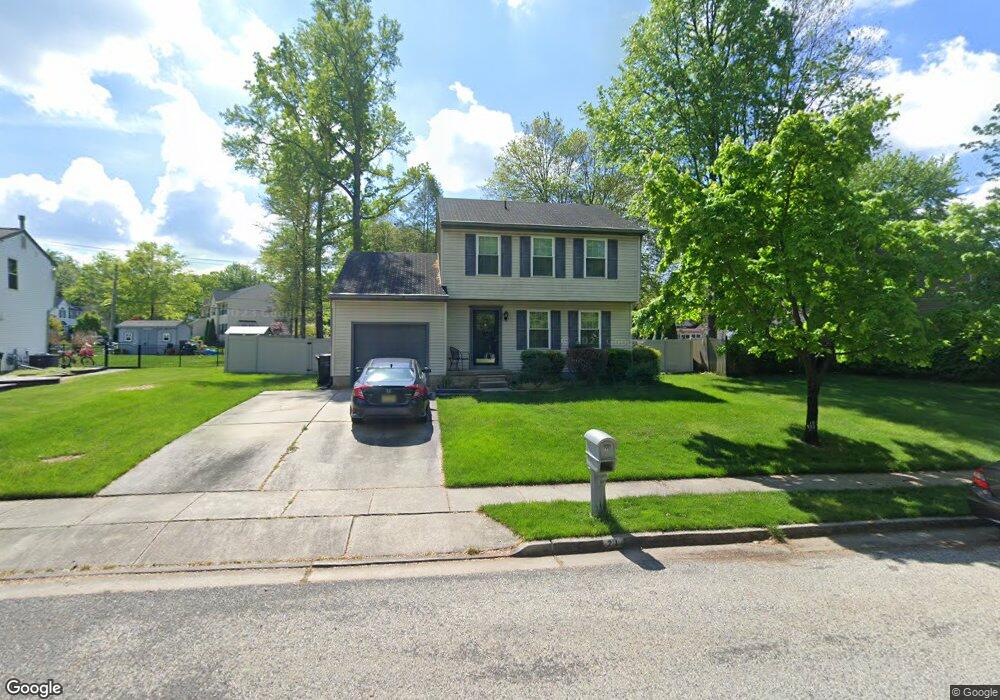
21 Willow Bend Dr Mantua, NJ 08051
Mantua Township NeighborhoodEstimated Value: $469,577 - $521,000
--
Bed
--
Bath
1,944
Sq Ft
$255/Sq Ft
Est. Value
About This Home
This home is located at 21 Willow Bend Dr, Mantua, NJ 08051 and is currently estimated at $495,394, approximately $254 per square foot. 21 Willow Bend Dr is a home located in Gloucester County with nearby schools including Centre City School, Clearview Regional Middle School, and Clearview Regional High School.
Ownership History
Date
Name
Owned For
Owner Type
Purchase Details
Closed on
Apr 30, 2015
Sold by
Lattanzi Agnes L and Estater Of Patricia E Giovanet
Bought by
Russeli Ethan and Wilson Darlene1 D
Current Estimated Value
Purchase Details
Closed on
Dec 20, 2002
Sold by
Ferri Richard T and Ferri Donna M
Bought by
Ferri Richard T and Ferri Donna M
Home Financials for this Owner
Home Financials are based on the most recent Mortgage that was taken out on this home.
Original Mortgage
$124,600
Interest Rate
6.19%
Purchase Details
Closed on
Jul 26, 1996
Sold by
Skotnicki Daniel J and Skotnicki Margaret M
Bought by
Ferri Richard T and Feret Donna M
Home Financials for this Owner
Home Financials are based on the most recent Mortgage that was taken out on this home.
Original Mortgage
$130,300
Interest Rate
8.27%
Create a Home Valuation Report for This Property
The Home Valuation Report is an in-depth analysis detailing your home's value as well as a comparison with similar homes in the area
Home Values in the Area
Average Home Value in this Area
Purchase History
| Date | Buyer | Sale Price | Title Company |
|---|---|---|---|
| Russeli Ethan | -- | None Available | |
| Ferri Richard T | -- | Citizens Title Ins Agency In | |
| Ferri Richard T | $137,200 | -- |
Source: Public Records
Mortgage History
| Date | Status | Borrower | Loan Amount |
|---|---|---|---|
| Previous Owner | Ferri Richard T | $124,600 | |
| Previous Owner | Ferri Richard T | $130,300 |
Source: Public Records
Tax History Compared to Growth
Tax History
| Year | Tax Paid | Tax Assessment Tax Assessment Total Assessment is a certain percentage of the fair market value that is determined by local assessors to be the total taxable value of land and additions on the property. | Land | Improvement |
|---|---|---|---|---|
| 2025 | $9,386 | $364,500 | $110,700 | $253,800 |
| 2024 | $9,287 | $364,500 | $110,700 | $253,800 |
| 2023 | $9,287 | $364,500 | $110,700 | $253,800 |
| 2022 | $7,836 | $224,000 | $61,500 | $162,500 |
| 2021 | $7,894 | $224,000 | $61,500 | $162,500 |
| 2020 | $7,831 | $224,000 | $61,500 | $162,500 |
| 2019 | $7,699 | $224,000 | $61,500 | $162,500 |
| 2018 | $7,589 | $224,000 | $61,500 | $162,500 |
| 2017 | $7,475 | $224,000 | $61,500 | $162,500 |
| 2016 | $7,390 | $224,000 | $61,500 | $162,500 |
| 2015 | $7,208 | $224,000 | $61,500 | $162,500 |
| 2014 | $6,966 | $224,000 | $61,500 | $162,500 |
Source: Public Records
Map
Nearby Homes
- 333 Jackson Rd
- 41 Woodbrook Dr Unit C041
- 17 Oakton Dr
- 580 Mount Royal Rd
- 284 Columbus Dr
- 608 Main St
- 290 Montgomery Dr
- 26 Woodstream Ct
- 119 Monroe Ave
- 590 Bridgeton Pike
- 380 Heritage Rd
- 680 Main St
- 485 Harrison Ave
- 325 Bridgeton Pike
- 204 W Landing Rd
- 36 Bluebird Rd
- 8 Barry Dr
- 22 Hart Ln
- 47 New Jersey Ave
- 261 Tony Cir
- 19 Willow Bend Dr
- 23 Willow Bend Dr
- 12 Willow Bend Dr
- 17 Willow Bend Dr
- 14 Willow Bend Dr
- 7 Woodmont Ct
- 2 Candlewood Dr
- 10 Willow Bend Dr
- 16 Willow Bend Dr
- 18 Willow Bend Dr
- 20 Willow Bend Dr
- 3 Woodmont Ct
- 4 Candlewood Dr
- 15 Willow Bend Dr
- 8 Willow Bend Dr
- 1 Candlewood Dr
- 9 Woodmont Ct
- 1 Woodmont Ct
- 13 Willow Bend Dr
- 6 Candlewood Dr