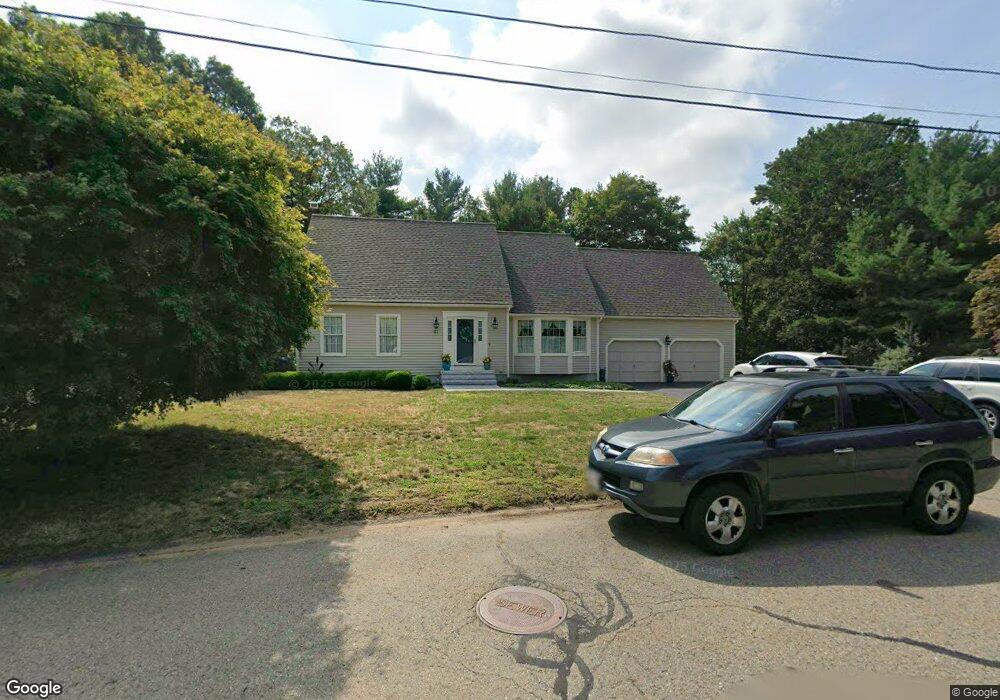
21 Winchester Cir North Attleboro, MA 02760
North Attleboro NeighborhoodEstimated Value: $702,000 - $860,000
3
Beds
3
Baths
2,033
Sq Ft
$372/Sq Ft
Est. Value
About This Home
This home is located at 21 Winchester Cir, North Attleboro, MA 02760 and is currently estimated at $755,538, approximately $371 per square foot. 21 Winchester Cir is a home located in Bristol County with nearby schools including North Attleboro High School, Cadence Academy Preschool - North Attleborough, and Bishop Feehan High School.
Ownership History
Date
Name
Owned For
Owner Type
Purchase Details
Closed on
Feb 7, 1992
Sold by
Obrien & Meeks Constr
Bought by
Blomstedt Bgarry W and Blomstedt Angela
Current Estimated Value
Home Financials for this Owner
Home Financials are based on the most recent Mortgage that was taken out on this home.
Original Mortgage
$152,800
Interest Rate
8.23%
Mortgage Type
Purchase Money Mortgage
Create a Home Valuation Report for This Property
The Home Valuation Report is an in-depth analysis detailing your home's value as well as a comparison with similar homes in the area
Home Values in the Area
Average Home Value in this Area
Purchase History
| Date | Buyer | Sale Price | Title Company |
|---|---|---|---|
| Blomstedt Bgarry W | $191,000 | -- |
Source: Public Records
Mortgage History
| Date | Status | Borrower | Loan Amount |
|---|---|---|---|
| Open | Blomstedt Bgarry W | $138,500 | |
| Closed | Blomstedt Bgarry W | $152,800 |
Source: Public Records
Tax History Compared to Growth
Tax History
| Year | Tax Paid | Tax Assessment Tax Assessment Total Assessment is a certain percentage of the fair market value that is determined by local assessors to be the total taxable value of land and additions on the property. | Land | Improvement |
|---|---|---|---|---|
| 2025 | $7,699 | $653,000 | $148,900 | $504,100 |
| 2024 | $7,298 | $632,400 | $148,900 | $483,500 |
| 2023 | $7,508 | $587,000 | $155,300 | $431,700 |
| 2022 | $6,813 | $489,100 | $148,900 | $340,200 |
| 2021 | $6,396 | $448,200 | $148,900 | $299,300 |
| 2020 | $6,219 | $433,400 | $148,900 | $284,500 |
| 2019 | $6,028 | $423,300 | $135,300 | $288,000 |
| 2018 | $5,348 | $400,900 | $135,300 | $265,600 |
| 2017 | $4,936 | $373,400 | $135,300 | $238,100 |
| 2016 | $5,124 | $387,600 | $156,800 | $230,800 |
| 2015 | $4,711 | $358,500 | $163,400 | $195,100 |
| 2014 | $4,416 | $333,500 | $143,400 | $190,100 |
Source: Public Records
Map
Nearby Homes
- 10 Sleepy Hollow Cir
- 11 Landry Ave
- 16 Raymond Hall Dr
- 116 George St
- 15 Old Wood Rd
- 57 Vine St
- Lot 5 Jeffrey Dr
- Lot 2 Jeffrey Dr
- 115 Westfield Dr
- 17 Peters Way
- 36 Cranberry Rd
- 28 Messenger St
- 2 George St Unit C
- 1730 West St
- 12 Houde St
- 122 Mary Ann Way
- 33 Dublin Way
- 166 E Bacon St Unit 4
- 47 Old Farm Rd
- 3 Serengeti Dr