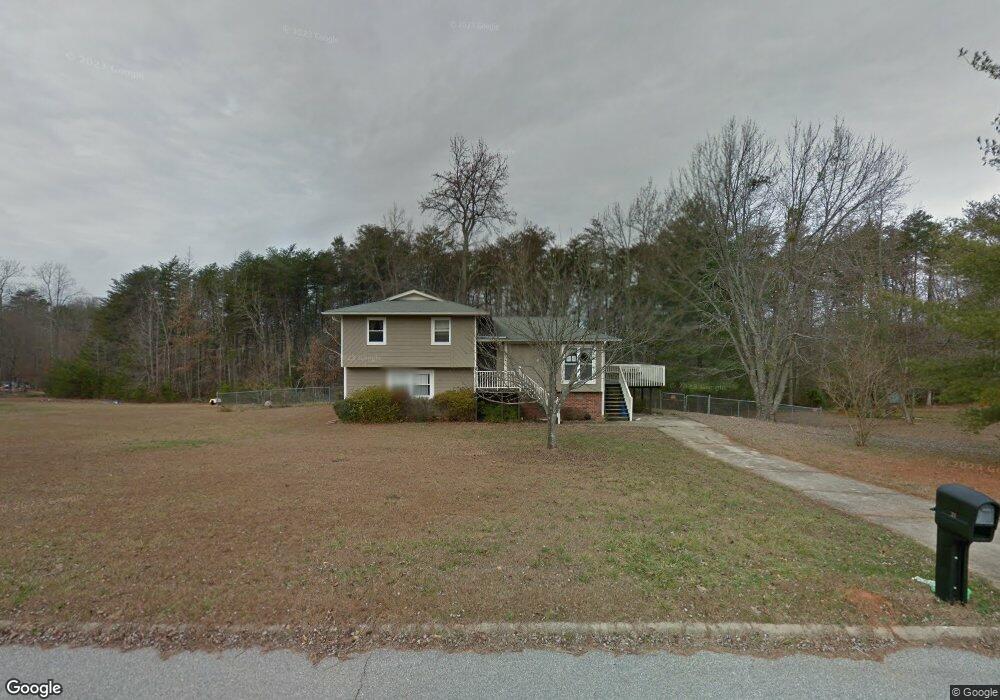
21 Windtree Ct Travelers Rest, SC 29690
Estimated Value: $233,000 - $322,000
3
Beds
2
Baths
1,523
Sq Ft
$192/Sq Ft
Est. Value
About This Home
This home is located at 21 Windtree Ct, Travelers Rest, SC 29690 and is currently estimated at $292,333, approximately $191 per square foot. 21 Windtree Ct is a home located in Greenville County with nearby schools including Gateway Elementary School, Northwest Middle School, and Travelers Rest High School.
Ownership History
Date
Name
Owned For
Owner Type
Purchase Details
Closed on
Jun 7, 2013
Sold by
Coleman Sammons R
Bought by
Coleman Sammons R and Coleman Rebecca L
Current Estimated Value
Home Financials for this Owner
Home Financials are based on the most recent Mortgage that was taken out on this home.
Original Mortgage
$90,000
Outstanding Balance
$63,677
Interest Rate
3.37%
Mortgage Type
VA
Estimated Equity
$228,656
Purchase Details
Closed on
Mar 6, 2013
Sold by
Lugo Nancy K
Bought by
Jpmorgan Chase Bank National Association
Purchase Details
Closed on
Dec 15, 2009
Sold by
Jones Charles M and Jones Amanda L
Bought by
Lugo Nancy K
Home Financials for this Owner
Home Financials are based on the most recent Mortgage that was taken out on this home.
Original Mortgage
$131,478
Interest Rate
5.01%
Mortgage Type
New Conventional
Purchase Details
Closed on
Nov 27, 2002
Sold by
Smith Rene' Knight
Bought by
Lagerholm Amanda L
Create a Home Valuation Report for This Property
The Home Valuation Report is an in-depth analysis detailing your home's value as well as a comparison with similar homes in the area
Home Values in the Area
Average Home Value in this Area
Purchase History
| Date | Buyer | Sale Price | Title Company |
|---|---|---|---|
| Coleman Sammons R | -- | -- | |
| Coleman Sammons R | $90,000 | -- | |
| Jpmorgan Chase Bank National Association | $77,180 | -- | |
| Lugo Nancy K | $128,900 | -- | |
| Lagerholm Amanda L | $92,900 | -- |
Source: Public Records
Mortgage History
| Date | Status | Borrower | Loan Amount |
|---|---|---|---|
| Open | Coleman Sammons R | $90,000 | |
| Previous Owner | Lugo Nancy K | $131,478 |
Source: Public Records
Tax History Compared to Growth
Tax History
| Year | Tax Paid | Tax Assessment Tax Assessment Total Assessment is a certain percentage of the fair market value that is determined by local assessors to be the total taxable value of land and additions on the property. | Land | Improvement |
|---|---|---|---|---|
| 2024 | $755 | $4,530 | $1,040 | $3,490 |
| 2023 | $755 | $4,530 | $1,040 | $3,490 |
| 2022 | $734 | $4,530 | $1,040 | $3,490 |
| 2021 | $722 | $4,530 | $1,040 | $3,490 |
| 2020 | $720 | $4,210 | $900 | $3,310 |
| 2019 | $716 | $4,210 | $900 | $3,310 |
| 2018 | $733 | $4,210 | $900 | $3,310 |
| 2017 | $728 | $4,210 | $900 | $3,310 |
| 2016 | $690 | $105,140 | $22,500 | $82,640 |
| 2015 | $674 | $105,140 | $22,500 | $82,640 |
| 2014 | $675 | $105,670 | $20,000 | $85,670 |
Source: Public Records
Map
Nearby Homes
- 5705 State Park Rd
- 2070 Little Texas Rd
- 1 Wild Fern Ct
- 9 Wild Fern Ct
- 4 Halowell Ln
- 3 Halowell Ln
- 12 Halowell Ln
- 11 Halowell Ln
- 210 Brayton Ct
- 112 Halowell Ln
- 120 Halowell Ln
- 705 Ravel Ct
- 15 Hindman Rd
- 110 Colony Rd
- 11 Echo Dr
- 207 Grandview Cir
- 129 Shager Place
- 4 Dell Cir
- 6206 State Park Rd
- 400 Trillium Creek Ct
- 21 Windtree Ct Unit Paris Mtn area
- 15 Windtree Ct
- 25 Windtree Ct
- 20 Windtree Ct
- 16 Windtree Ct
- 24 Windtree Ct
- 29 Windtree Ct
- 11 Windtree Ct
- 28 Windtree Ct
- 12 Windtree Ct
- 9 Windtree Ct
- 35 Windtree Ct
- 10 Windtree Ct
- 34 Windtree Ct
- 39 Windtree Ct
- 42 Windtree Ct
- 5 Windtree Ct
- 6 Windtree Ct
- 40 Windtree Ct
- 268 Wild Orchard Rd