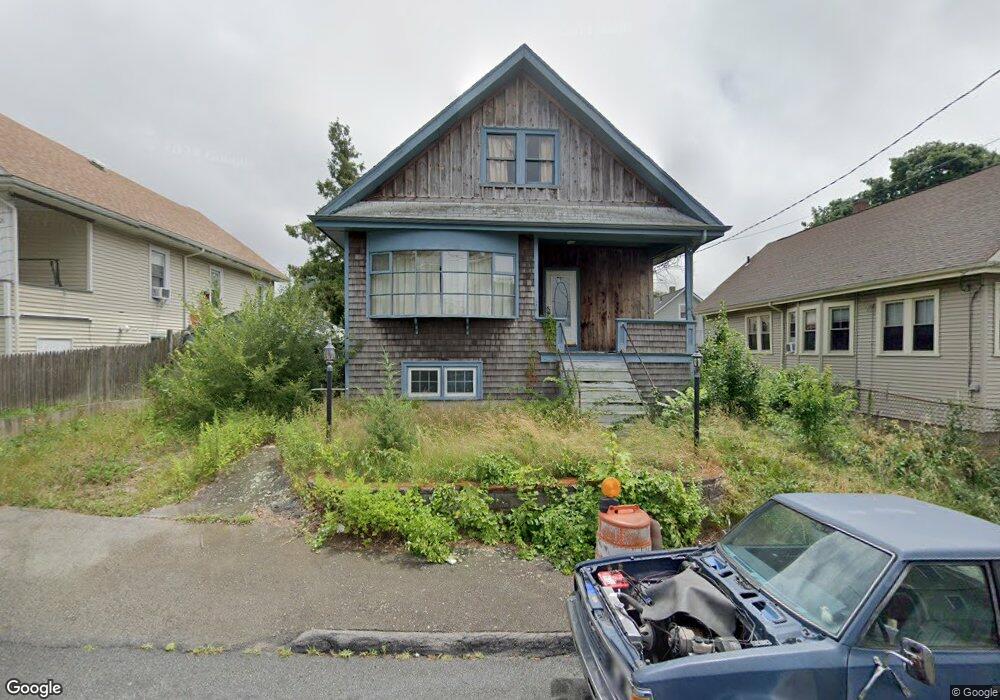
21 Winsor St Fairhaven, MA 02719
North Fairhaven NeighborhoodEstimated Value: $364,000 - $432,925
3
Beds
1
Bath
1,185
Sq Ft
$344/Sq Ft
Est. Value
About This Home
This home is located at 21 Winsor St, Fairhaven, MA 02719 and is currently estimated at $407,481, approximately $343 per square foot. 21 Winsor St is a home located in Bristol County with nearby schools including Fairhaven High School, Alma Del Mar Charter School, and St. Joseph School.
Ownership History
Date
Name
Owned For
Owner Type
Purchase Details
Closed on
Aug 10, 2016
Sold by
Fhlmc
Bought by
Dumas Luke M and Pereira Elizabeth C
Current Estimated Value
Home Financials for this Owner
Home Financials are based on the most recent Mortgage that was taken out on this home.
Original Mortgage
$151,701
Outstanding Balance
$120,133
Interest Rate
3.25%
Mortgage Type
FHA
Estimated Equity
$287,348
Purchase Details
Closed on
Jan 11, 2016
Sold by
Verrette Maria and Sanrander Bank Na
Bought by
Fhlmc
Purchase Details
Closed on
Oct 13, 1995
Sold by
Woodis Wayne R and Woodis Jo Ann
Bought by
Verrette Ronald R and Verrette Maria
Create a Home Valuation Report for This Property
The Home Valuation Report is an in-depth analysis detailing your home's value as well as a comparison with similar homes in the area
Home Values in the Area
Average Home Value in this Area
Purchase History
| Date | Buyer | Sale Price | Title Company |
|---|---|---|---|
| Dumas Luke M | $156,925 | -- | |
| Fhlmc | $185,612 | -- | |
| Verrette Ronald R | $100,000 | -- |
Source: Public Records
Mortgage History
| Date | Status | Borrower | Loan Amount |
|---|---|---|---|
| Open | Dumas Luke M | $151,701 | |
| Previous Owner | Verrette Ronald R | $21,000 | |
| Previous Owner | Verrette Ronald R | $250,000 | |
| Previous Owner | Verrette Ronald R | $245,337 |
Source: Public Records
Tax History Compared to Growth
Tax History
| Year | Tax Paid | Tax Assessment Tax Assessment Total Assessment is a certain percentage of the fair market value that is determined by local assessors to be the total taxable value of land and additions on the property. | Land | Improvement |
|---|---|---|---|---|
| 2025 | $34 | $360,000 | $168,700 | $191,300 |
| 2024 | $3,226 | $349,500 | $168,700 | $180,800 |
| 2023 | $3,156 | $317,200 | $147,800 | $169,400 |
| 2022 | $3,058 | $299,200 | $137,300 | $161,900 |
| 2021 | $2,905 | $257,300 | $124,300 | $133,000 |
| 2020 | $2,846 | $257,300 | $124,300 | $133,000 |
| 2019 | $2,623 | $224,800 | $103,100 | $121,700 |
| 2018 | $2,524 | $214,800 | $98,100 | $116,700 |
| 2017 | $2,492 | $207,000 | $98,100 | $108,900 |
| 2016 | $2,401 | $197,100 | $98,100 | $99,000 |
| 2015 | $2,375 | $195,500 | $98,100 | $97,400 |
Source: Public Records
Map
Nearby Homes