NOT LISTED FOR SALE

21 Woodfield Place Danville, IN 46122

Estimated Value: $624,000 - $682,000

4 Beds
5 Baths
2,879 Sq Ft
$228/Sq Ft Est. Value

Last Sold June 15, 2012

Last sale price $347,500 $121 Per Sq Ft

Est. 89% increase in value since last sale

Current estimated payment $3,966/month

About This Home

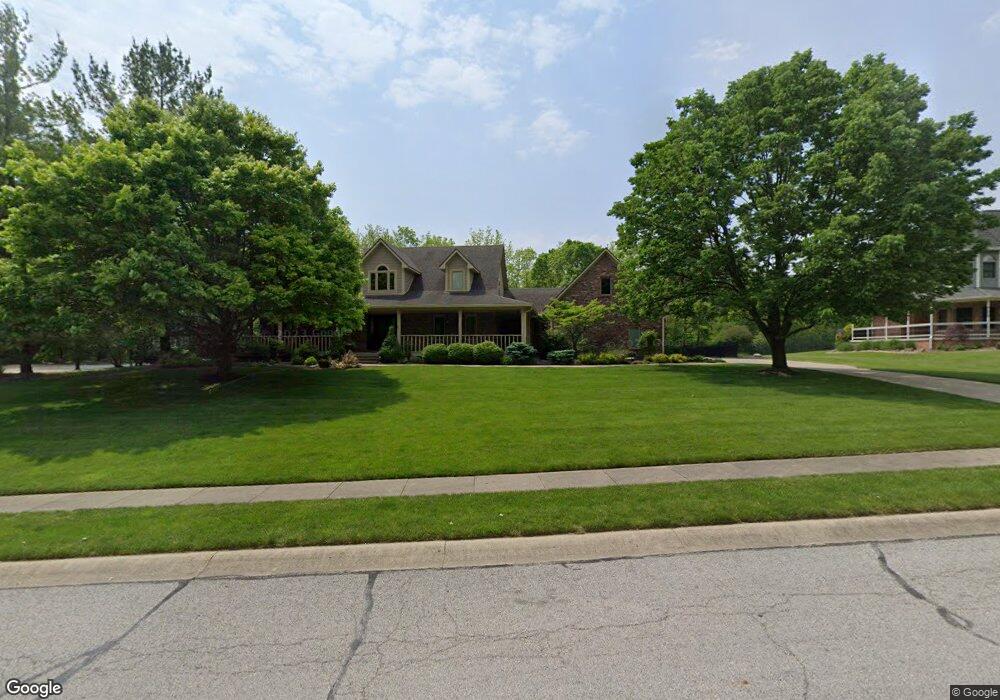
It's got a POOL! You will love this home from the covered wrap around front porch to the beautiful 18x42 pool, also features 4 big bedrooms, master suite, two story great room w/fireplace, kitchen with breakfast area, formal dining room, finished basement w/fireplace and bonus room, screened patio, 3 car garage with 34x15 floored storage area, all this with a perfect setting. New roof installed August 2011.

Ownership History

Date Name Owned For Owner Type

Purchase Details

Listed on
Jul 11, 2011
Closed on
Jun 15, 2012
Sold by
Swick Mark W and Swick Suzanne M
Bought by
Klein James C and Klein Marnie E
Seller's Agent
Dan Weathers
Dropped Members
Buyer's Agent
Mike Ellis
RE/MAX Centerstone
List Price
$347,500
Sold Price
$347,500
Current Estimated Value
$657,839

Home Financials for this Owner

Home Financials are based on the most recent Mortgage that was taken out on this home.
Estimated Appreciation
$310,339
Avg. Annual Appreciation
4.89%
Original Mortgage
$330,030
Outstanding Balance
$229,151
Interest Rate
3.87%
Mortgage Type
New Conventional
Estimated Equity
$428,688
Source: Public Records

Range of Values:

Collateral Analytics

Collateral Analytics Collateral Analytics AVMs (Automated Valuation Model) employ a number of statistical approaches combined with neighborhood-specific comparable selection guarantees the most up-to-date and precise valuations.

Not Available

Collateral Analytics does not have data for the current month. Please view the chart for historical values.

ICE

ICE Mortgage Technology ICE Mortgage Technology’s AVM (Automated Valuation Model) is a state-of-the-art online residential property valuation tool that provides a quick and accurate estimate of the value of almost any home in the U.S.

Not Available

ICE Mortgage Technology does not have data for the current month. Please view the chart for historical values.

First American

First American First American Data & Analytics’ next-generation AVM combines unrivaled data assets with a blended ensemble of valuation models to produce highly accurate, reliable valuations you can trust.

Not Available

First American does not have data for the current month. Please view the chart for historical values.

Quantarium

Quantarium Quantarium’s valuation service, repeatedly proven the industry’s most accurate and comprehensive, is supercharged with a self-learning and auto-tuning AI engine that continually becomes smarter and more accurate as it processes daily inputs from the industry’s leading RE data lake.

Not Available

Quantarium does not have data for the current month. Please view the chart for historical values.

Average Value
Not Available
List Price
Sold Price
Create a Home Valuation Report for This Property
The Home Valuation Report is an in-depth analysis detailing your home's value as well as a comparison with similar homes in the area

Home Values in the Area

Source: Public Records

Average Home Value in this Area


Source: Public Records

Purchase History

Date Buyer Sale Price Title Company
Klein James C -- None Available
Source: Public Records

Mortgage History

Date Status Borrower Loan Amount
Open Klein James C $330,030
Source: Public Records

Property History

Date Event Price List to Sale Price per Sq Ft Prior Sale
06/15/2012 06/15/12 Sold $347,500 0.0% $121 / Sq Ft View Prior Sale
04/13/2012 04/13/12 Pending -- -- --
07/11/2011 07/11/11 For Sale $347,500 -- $121 / Sq Ft

Tax History Compared to Growth

Source: Public Records

Tax History

Year Tax Paid Tax Assessment Tax Assessment Total Assessment is a certain percentage of the fair market value that is determined by local assessors to be the total taxable value of land and additions on the property. Land Improvement
2024 $6,043 $602,800 $65,100 $537,700
2023 $5,320 $526,700 $59,200 $467,500
2022 $5,020 $503,300 $56,400 $446,900
2021 $4,540 $455,200 $55,300 $399,900
2020 $4,122 $412,700 $55,300 $357,400
2019 $4,231 $407,500 $55,700 $351,800
2018 $4,270 $403,700 $55,700 $348,000
2017 $4,104 $384,300 $53,500 $330,800
2016 $3,939 $370,900 $53,500 $317,400
2014 $4,115 $336,700 $47,600 $289,100
Source: Public Records

Agents Affiliated with this Home

  • Section Image
  • Section Image
  • Section Image
See All Agents

Map