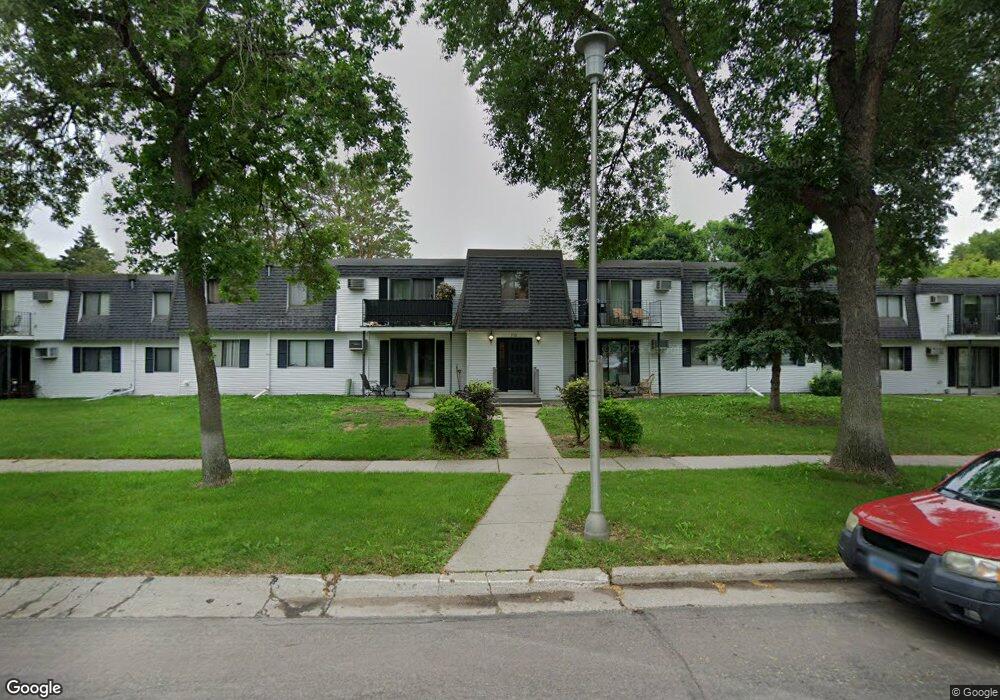
210 35th Ave N Unit 11 Fargo, ND 58102
Trollwood NeighborhoodEstimated Value: $98,519 - $107,000
2
Beds
1
Bath
924
Sq Ft
$111/Sq Ft
Est. Value
About This Home
This home is located at 210 35th Ave N Unit 11, Fargo, ND 58102 and is currently estimated at $102,880, approximately $111 per square foot. 210 35th Ave N Unit 11 is a home located in Cass County with nearby schools including Longfellow Elementary School, Ben Franklin Middle School, and North High School.
Ownership History
Date
Name
Owned For
Owner Type
Purchase Details
Closed on
Jul 19, 2013
Sold by
Mayer Kathi L
Bought by
Overmay Properties Llc
Current Estimated Value
Purchase Details
Closed on
Jul 15, 2013
Sold by
Swanson Odean L and Swanson Dorene L
Bought by
Mayer Kathi L
Purchase Details
Closed on
Mar 15, 2007
Sold by
Prushek Mabel L and Prushek Joseph E
Bought by
Swamson O Dean L and Swamson Dorene L
Home Financials for this Owner
Home Financials are based on the most recent Mortgage that was taken out on this home.
Original Mortgage
$55,800
Interest Rate
6.31%
Mortgage Type
New Conventional
Create a Home Valuation Report for This Property
The Home Valuation Report is an in-depth analysis detailing your home's value as well as a comparison with similar homes in the area
Home Values in the Area
Average Home Value in this Area
Purchase History
| Date | Buyer | Sale Price | Title Company |
|---|---|---|---|
| Overmay Properties Llc | -- | None Available | |
| Mayer Kathi L | $55,000 | None Available | |
| Swamson O Dean L | -- | -- |
Source: Public Records
Mortgage History
| Date | Status | Borrower | Loan Amount |
|---|---|---|---|
| Previous Owner | Swamson O Dean L | $55,800 |
Source: Public Records
Tax History Compared to Growth
Tax History
| Year | Tax Paid | Tax Assessment Tax Assessment Total Assessment is a certain percentage of the fair market value that is determined by local assessors to be the total taxable value of land and additions on the property. | Land | Improvement |
|---|---|---|---|---|
| 2024 | $1,161 | $42,450 | $7,250 | $35,200 |
| 2023 | $1,155 | $42,450 | $7,250 | $35,200 |
| 2022 | $1,158 | $40,800 | $7,250 | $33,550 |
| 2021 | $1,109 | $40,800 | $7,250 | $33,550 |
| 2020 | $1,043 | $38,850 | $7,250 | $31,600 |
| 2019 | $1,045 | $38,850 | $4,300 | $34,550 |
| 2018 | $1,040 | $39,200 | $4,300 | $34,900 |
| 2017 | $990 | $36,650 | $4,300 | $32,350 |
| 2016 | $814 | $33,300 | $4,300 | $29,000 |
| 2015 | $892 | $33,300 | $2,950 | $30,350 |
| 2014 | $851 | $31,900 | $2,950 | $28,950 |
| 2013 | $852 | $31,900 | $2,950 | $28,950 |
Source: Public Records
Map
Nearby Homes
- 3306 2nd St N Unit D26
- 3217 Cherry Ln N
- 3531 1st St N
- 21 35th Ave NE
- 108 32nd Ave N
- 2937 Edgewood Dr N
- 2925 Edgewood Dr N
- 2926 Edgewood Dr N
- 801 32nd Ave N Unit A102
- 3129 8th St N
- 3667 Evergreen Rd N
- 3113 8th St N
- 3513 Par St N
- 501 Forest Ave N Unit C
- 2902 3rd St N
- 2939 Maple St N
- 2807 Edgewood Dr N
- 87 28th Ave N
- 1031 Gibraltor Ave
- 101 27th Ave N
- 218 35th Ave N Unit 19
- 210 35th Ave N Unit 12
- 210 35th Ave N Unit 10
- 218 35th Ave N Unit 24
- 218 35th Ave N Unit 23
- 218 35th Ave N Unit 22
- 218 35th Ave N Unit 21
- 218 35th Ave N Unit 20
- 218 35th Ave N Unit 18
- 218 35th Ave N Unit 17
- 210 35th Ave N Unit 16
- 210 35th Ave N Unit 15
- 210 35th Ave N Unit 14
- 210 35th Ave N Unit 13
- 210 35th Ave N Unit 9
- 210 35th Ave N
- 218 35th Ave N
- 210 35th Ave N Unit 9
- 210 35th Ave N
- 202 35th Ave N Unit 4