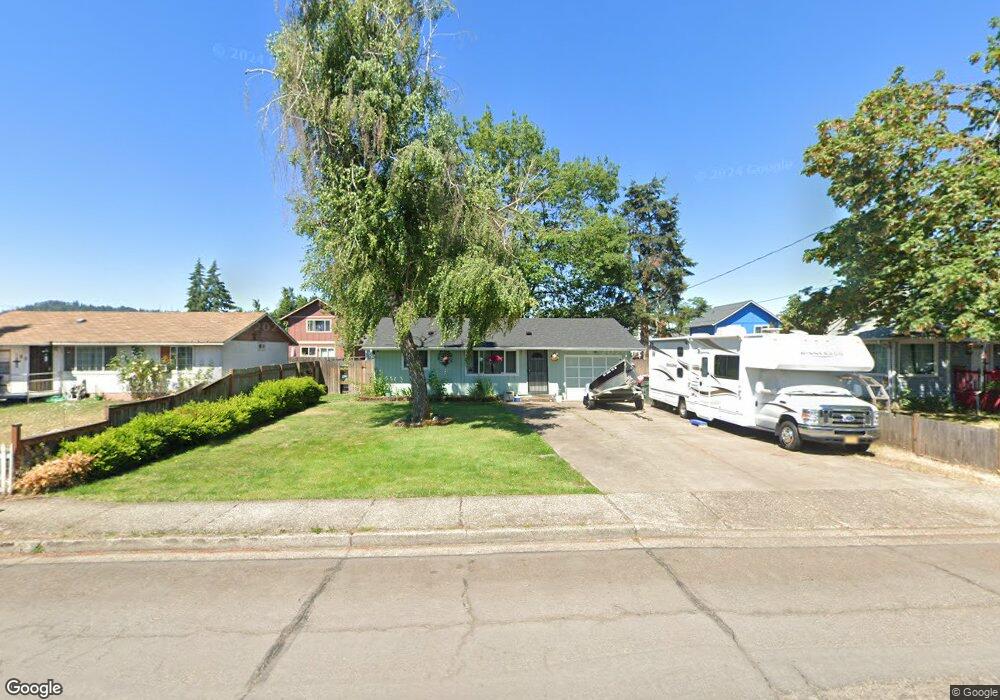
210 36th St Springfield, OR 97478
East Springfield NeighborhoodEstimated Value: $293,000 - $333,000
2
Beds
1
Bath
904
Sq Ft
$349/Sq Ft
Est. Value
About This Home
This home is located at 210 36th St, Springfield, OR 97478 and is currently estimated at $315,705, approximately $349 per square foot. 210 36th St is a home located in Lane County with nearby schools including Riverbend Elementary School, Briggs Middle School, and Thurston High School.
Ownership History
Date
Name
Owned For
Owner Type
Purchase Details
Closed on
Jun 17, 2003
Sold by
Burke Joseph N
Bought by
Meyers Jason W and Meyers Tamara F
Current Estimated Value
Home Financials for this Owner
Home Financials are based on the most recent Mortgage that was taken out on this home.
Original Mortgage
$107,217
Outstanding Balance
$45,715
Interest Rate
5.53%
Mortgage Type
FHA
Estimated Equity
$269,990
Purchase Details
Closed on
Jun 12, 1998
Sold by
1-2 Boggs Paul D and 1-2 Doan Randy
Bought by
Burke Joseph N
Home Financials for this Owner
Home Financials are based on the most recent Mortgage that was taken out on this home.
Original Mortgage
$82,150
Interest Rate
7.11%
Create a Home Valuation Report for This Property
The Home Valuation Report is an in-depth analysis detailing your home's value as well as a comparison with similar homes in the area
Home Values in the Area
Average Home Value in this Area
Purchase History
| Date | Buyer | Sale Price | Title Company |
|---|---|---|---|
| Meyers Jason W | $108,900 | Fidelity Natl Title Co Of Or | |
| Burke Joseph N | $86,500 | Cascade Title Co |
Source: Public Records
Mortgage History
| Date | Status | Borrower | Loan Amount |
|---|---|---|---|
| Open | Meyers Jason W | $107,217 | |
| Previous Owner | Burke Joseph N | $82,150 |
Source: Public Records
Tax History
| Year | Tax Paid | Tax Assessment Tax Assessment Total Assessment is a certain percentage of the fair market value that is determined by local assessors to be the total taxable value of land and additions on the property. | Land | Improvement |
|---|---|---|---|---|
| 2025 | $2,087 | $113,823 | -- | -- |
| 2024 | $2,053 | $110,508 | -- | -- |
| 2023 | $2,053 | $107,290 | $0 | $0 |
| 2022 | $1,902 | $104,166 | $0 | $0 |
| 2021 | $1,868 | $101,133 | $0 | $0 |
| 2020 | $1,813 | $98,188 | $0 | $0 |
| 2019 | $1,759 | $95,329 | $0 | $0 |
| 2018 | $1,658 | $89,857 | $0 | $0 |
| 2017 | $1,594 | $89,857 | $0 | $0 |
| 2016 | $1,561 | $87,240 | $0 | $0 |
| 2015 | $1,516 | $84,699 | $0 | $0 |
| 2014 | $1,493 | $82,232 | $0 | $0 |
Source: Public Records
Map
Nearby Homes
Your Personal Tour Guide
Ask me questions while you tour the home.