G
Seller's Agent in 2019
Greta Overgard
RE/MAX
Estimated Value: $1,737,000 - $3,449,000
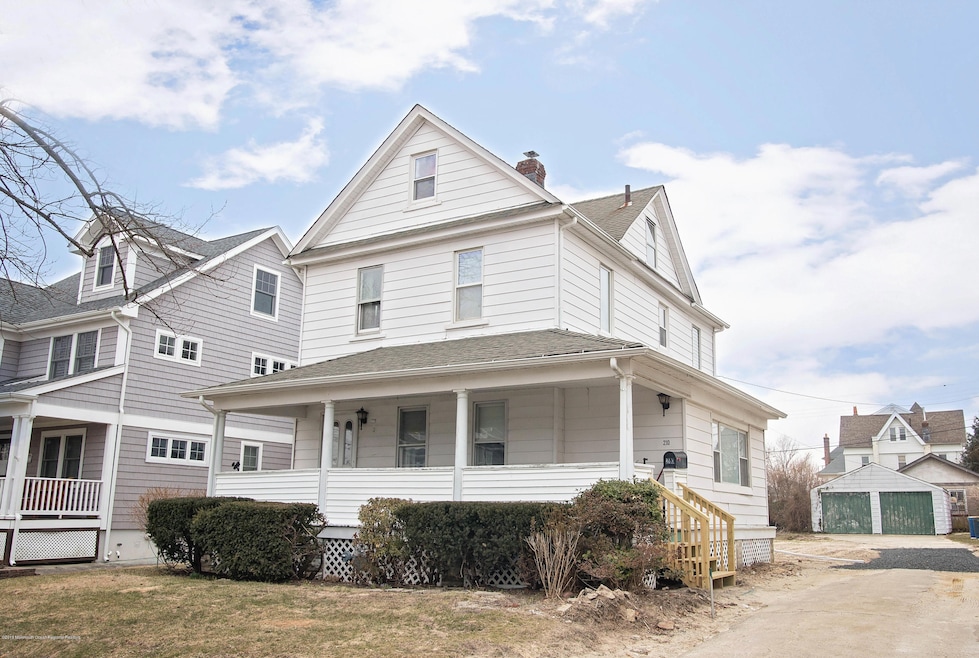
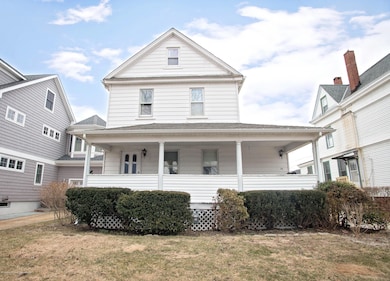
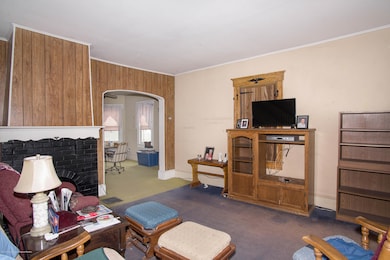
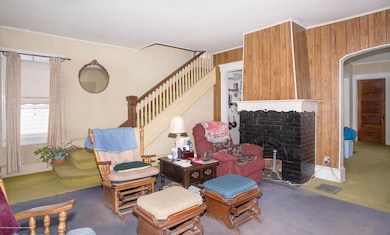
LOVE THE BEACH!!!!
This Prime Location at the North end of Belmar 2 blocks
from the Beauty of the Ocean. The Perfect place to
Relax and enjoy the Ocean Air.
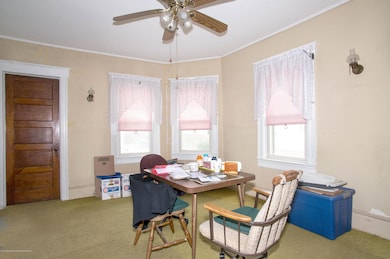
House being sold AS-IS!! Bring your Imagination and
make this your Perfect Home.
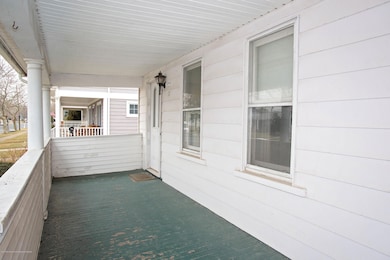
Feel the sand under your feet,Boardwalk, Great
Restaurants, Shopping and easy access to GSP, NY
and AC.
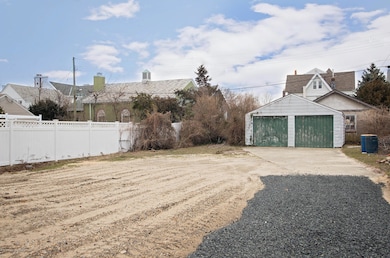
OPPORTUNITY IS JUST AROUND THE CORNER TO
MAKE YOUR DREAMS COME TRUE!!!!!
Last Agent to Sell the Property
Greta Overgard
Real Estate, LTD License #0121417 Listed on: 02/25/2019
Last Buyer's Agent
Berkshire Hathaway HomeServices Fox & Roach - Spring Lake License #1644256

| Date | Buyer | Sale Price | Title Company |
|---|---|---|---|
| Pipas Frank R | $775,000 | Tohickon Settlement Svcs Inc |
| Date | Status | Borrower | Loan Amount |
|---|---|---|---|
| Open | Pipas Frank R | $620,000 |
| Date | Event | Price | List to Sale | Price per Sq Ft |
|---|---|---|---|---|
| 04/29/2019 04/29/19 | Sold | $775,000 | -- | $488 / Sq Ft |
| Year | Tax Paid | Tax Assessment Tax Assessment Total Assessment is a certain percentage of the fair market value that is determined by local assessors to be the total taxable value of land and additions on the property. | Land | Improvement |
|---|---|---|---|---|
| 2025 | $22,282 | $1,531,400 | $650,000 | $881,400 |
| 2024 | $21,531 | $1,531,400 | $650,000 | $881,400 |
G
Seller's Agent in 2019
Greta Overgard
RE/MAX
Buyer's Agent in 2019
Edward James Szumski
BHHS Fox & Roach
(732) 859-3751
75 in this area
180 Total Sales
Source: MOREMLS (Monmouth Ocean Regional REALTORS®)
MLS Number: 21907520
APN: 07-00021-0000-00012
Disclaimer: Certain information contained herein is derived from information provided by parties other than Homes.com. All information provided is deemed reliable, but is not guaranteed to be accurate and should be independently verified.
![]() IDX information is provided exclusively for personal, non-commercial use, and may not be used for any purpose other than to identify prospective properties consumers may be interested in purchasing.
IDX information is provided exclusively for personal, non-commercial use, and may not be used for any purpose other than to identify prospective properties consumers may be interested in purchasing.
Information is deemed reliable but not guaranteed.
Ask me questions while you tour the home.